CS2 opening duels: first-kill teams win 72% of pro rounds
, 12 min read
Reviewed by Phil McParlane, Founder, on
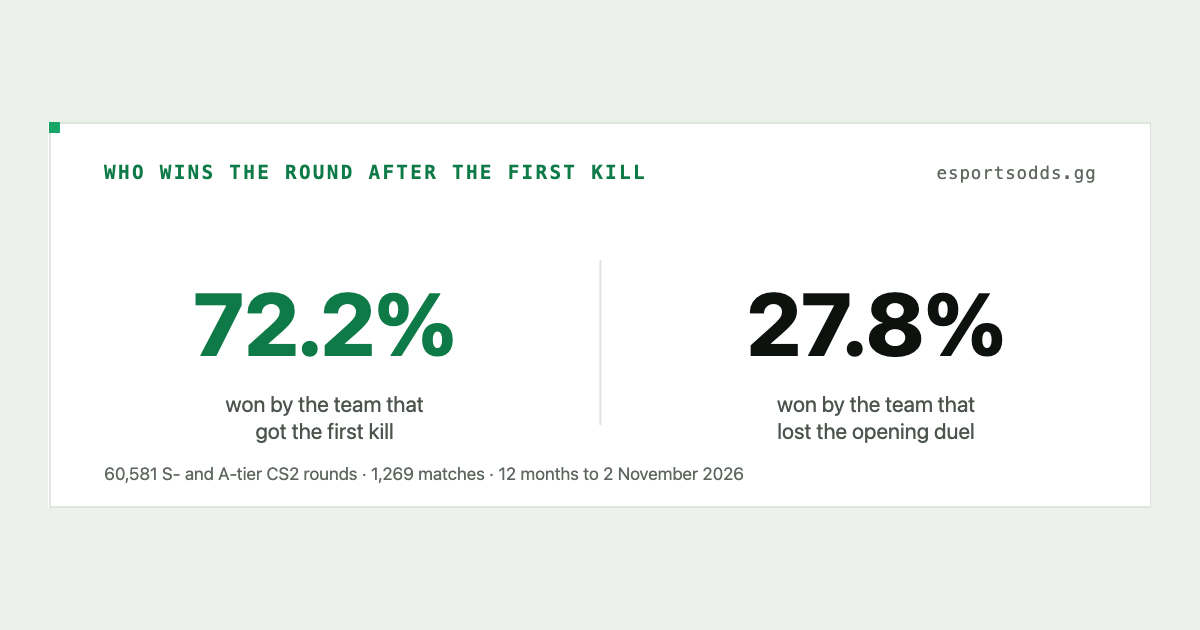
Bottom line: In CS2 opening duels across 60,581 S- and A-tier rounds from the last 12 months, the team that got the round's first kill went on to win 72.2% of them. Counter-Terrorists (CTs) get most first kills on every map, but Terrorists (Ts) and CTs turn a first kill into a round win about equally often, and the first kill is worth about the same in pistol rounds (68.9%) as when both teams have full buys (69.9%). A team that lost the opening duel but got a trade kill later won 37.1% of those rounds, against 17.4% with no trade kill. These figures are as of 2 November 2026. You can pull round-level data like this from the EsportsOdds CS2 data API.
Seven rounds in ten
The opening duel is the first kill of a round: the entry frag on one side, a lost player on the other. Here is how often the team that wins it goes on to take the round. It is 72.2% of the time. The team that lost the opening duel wins the other 27.8%.
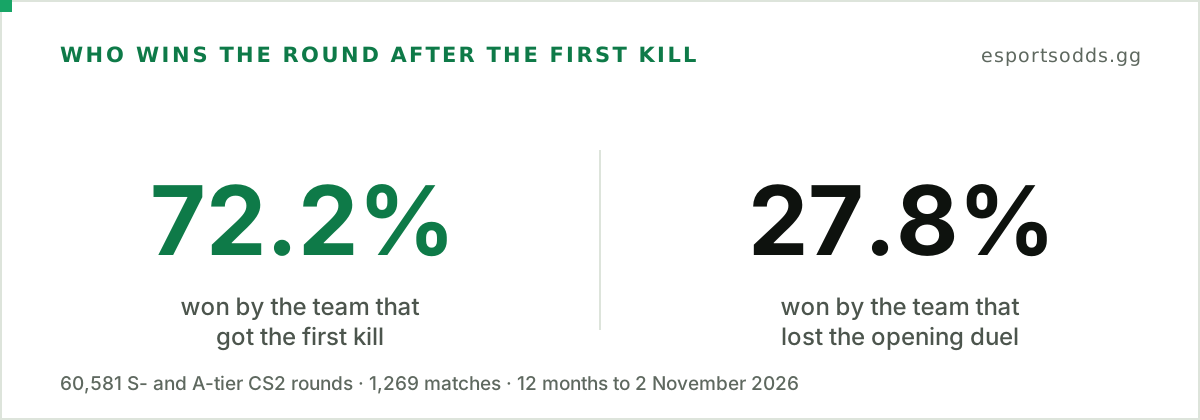
The data is every completed S- and A-tier match (the top two event tiers in our data) from the 12 months to 2 November 2026 with a clean round record: 1,269 matches and 60,581 rounds where we can tell who got the first kill, who died first and who won. We drop 484 rounds (0.8%): 208 with no opening kill recorded, and 276 where the opening kill and the opening death do not pair up across the two teams.
A 72.2% to 27.8% split is a 44-point gap. Rounds in one map are linked: money carries over from round to round and the same two teams play every round. So we count each map as one observation, not each round. On that basis the 72.2% could be off by about 0.4 points either way (a 95% margin, so the true figure is very likely inside it). A gap is clear when it is bigger than its margin, and inside the noise when it is not. Our comebacks study quotes 71.8% over a wider set of pro rounds; this one uses only S- and A-tier rounds from the last 12 months.
Read the gap as a description, not a recipe. The first kill may be partly a symptom: a team that has read the opponent's setup, or simply holds the better angle, is more likely to get it and more likely to win the round anyway. The split also does not control for team strength: a stronger team may win the opening duel and the round for the same reason. What the number does tell you is that a round is still won about one time in four after the opening duel is lost.
First kills by side and by map
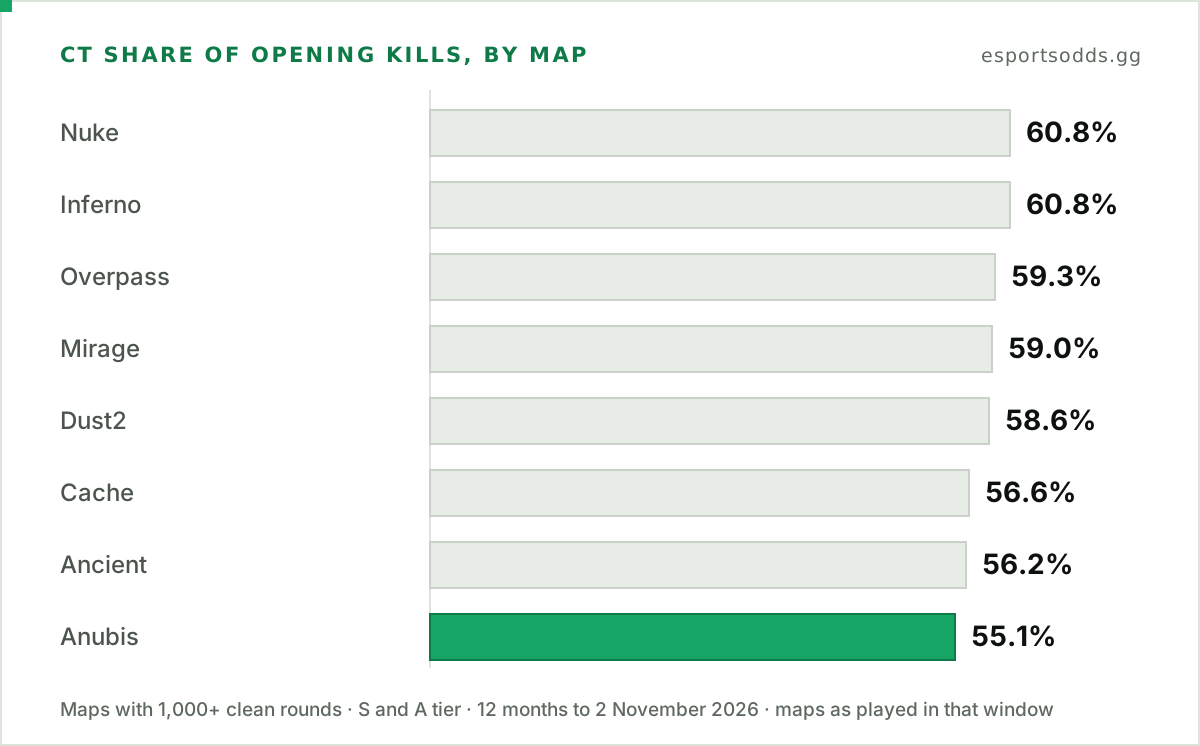
CTs get the first kill in 58.6% of rounds. That fits the shape of the game: Ts usually have to move into angles that CTs are already holding. Once a team has the first kill, the side makes little difference. Ts turn theirs into a round win 72.7% of the time and CTs 71.9% (we call this conversion). That is a gap of 0.8 points with a margin of 0.9, so it is inside the noise: the data shows no clear edge for either side.
| Map | CT share of first kills | Round win after first kill | Clean rounds | In the pool now |
|---|---|---|---|---|
| Nuke | 60.8% (±1.2) | 73.0% (±1.0) | 8,327 | Yes |
| Inferno | 60.8% (±1.1) | 71.5% (±1.0) | 8,488 | Yes |
| Overpass | 59.3% (±1.8) | 74.0% (±1.4) | 3,785 | No, replaced in Valve's 8 July 2026 update |
| Mirage | 59.0% (±1.0) | 72.6% (±0.8) | 11,195 | Yes |
| Dust2 | 58.6% (±1.0) | 72.4% (±0.8) | 11,541 | Yes |
| Cache | 56.6% (±2.0) | 71.5% (±1.6) | 3,184 | Yes, added in Valve's 8 July 2026 update |
| Ancient | 56.2% (±1.0) | 71.7% (±0.9) | 9,690 | Yes |
| Anubis | 55.1% (±1.8) | 70.8% (±1.4) | 3,661 | Yes |
The table lists 59,871 of the 60,581 rounds. The rest are 687 rounds on Train, which left the pool, and 23 on one unlisted map.
The map moves the CT share more than it moves conversion. CTs take 60.8% of first kills on Nuke and on Inferno, but only 55.1% on Anubis, the closest map to an even split on these numbers: a gap of 5.7 points, well outside the margins. Conversion moves less, 3.2 points from Anubis at 70.8% to Overpass at 74.0%. Overpass is the highest map. Its lead over Anubis, Inferno, Cache and Ancient (2.2 to 3.2 points before rounding) is clear. Over Dust2, Mirage and Nuke it is inside the margin, and Dust2 only just. With 28 pairs of maps compared, one or two could clear the margin by luck, so read the smaller gaps loosely.
A high CT share of first kills is not the same as a CT-sided map. Inferno ties for the top here, yet the Cache study has CTs winning only 51.2% of Inferno rounds (all tiers, 25 June to 17 October 2026). That study's table is also the better guide to the current pool; CS2 map win rates is an all-time table.
The table covers maps as they were played in the window, and Valve changed the pool twice in it: Train left and Anubis came back on 21 January 2026, then Overpass left and Cache joined on 8 July. In our S- and A-tier data some events used the new map up to five days early (the first Anubis map came on 16 January, the first Cache map on 3 July). The pool now is Ancient, Anubis, Cache, Dust2, Inferno, Mirage and Nuke, so Overpass, Cache and Anubis each cover only part of the 12 months.
First kills by buy type
Buy type matters less than you might expect, because the pistol and full-buy results are close. When both teams have a full buy, $18,000 or more of equipment each, the team with the first kill wins 69.9% of rounds (32,519 rounds). In pistol rounds it wins 68.9% (5,576 rounds). The gap is about one point with a margin of 1.3, so it is not clear: do not read one as lower than the other. Everything else, the ecos, force buys and mixed loadouts, sits at 76.4% (22,486 rounds), but read that one with care: it mixes rounds where the first kill came from the richer side with rounds where it did not, so some of that gap is probably the money.
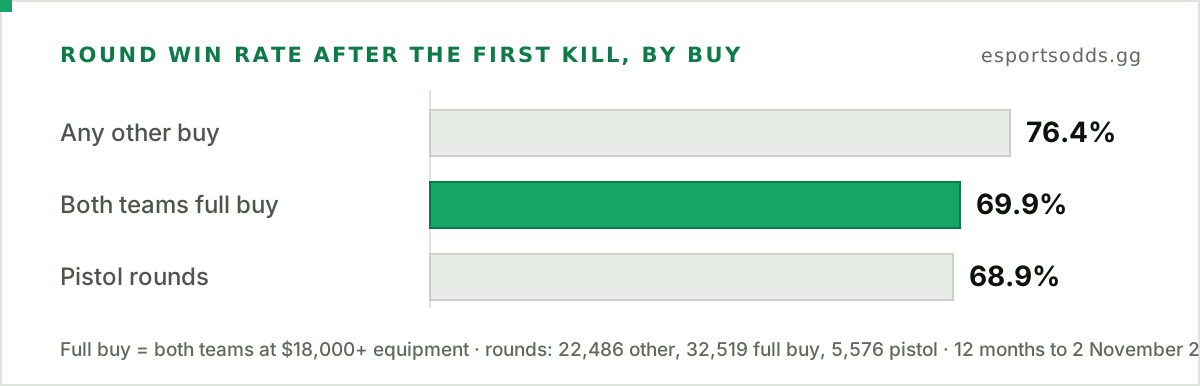
So in pistol rounds and in rounds where both teams have a full buy, the team with the first kill still wins about seven in ten, a little less often than the overall 72.2%. For how buys work in the first place, see the CS2 economy explained.
After a lost opening duel, trades and round wins go together
If the opening duel goes badly, the round is not over. A trade kill is killing the opponent who has just killed your teammate, and it is the standard answer to a lost entry.
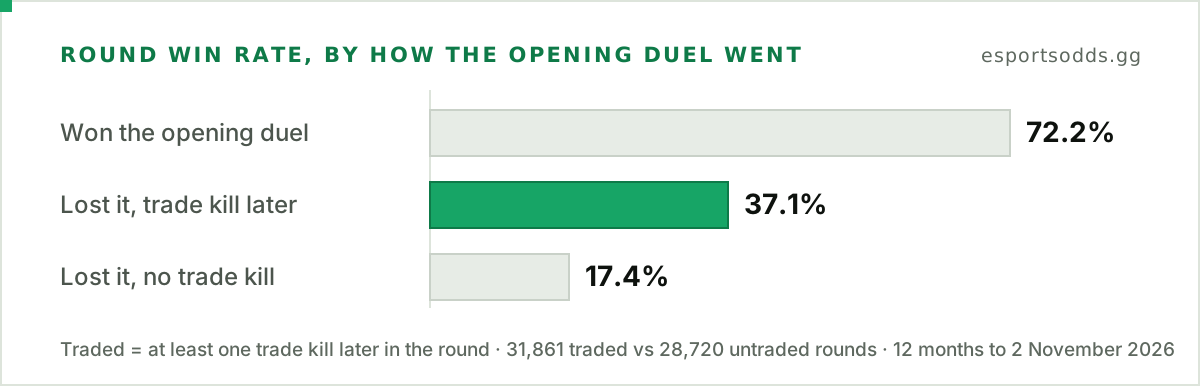
Teams that lost the opening duel but got at least one trade kill later in the round won 37.1% of those rounds (31,861 rounds). Teams that lost it and never traded won 17.4% (28,720 rounds). The gap is 19.7 points with a margin of 0.7, so it is clear. Three cautions. A trade kill is itself a kill, so this split partly measures whether the team killed anyone at all after the opener, and longer rounds give more chances to trade. Our round records hold trade counts per team, not who traded whom, so "traded" means any trade kill later in the round, not necessarily the opener's. And trading is easier when the rest of the setup is intact. So read the gap as an association: teams that traded won more than twice as often as teams that did not.
Opening duels by team, for the teams at PGL Masters Bucharest
PGL Masters Bucharest, an S-tier event, ran from 24 to 31 October 2026. Our data has 41 completed matches from it, with round records for all 97 maps. Each team played 3 to 8 matches there, with 142 to 428 clean rounds. That puts the margin on a team's opening share at the event alone between 3.7 and 9.2 points, too wide to compare teams. So the table below uses each team's full 12 months of rounds, which include the event. It covers 14 of the 16 teams that played it. It is a record of past rounds, not a ranking of team strength: each team played different opponents on different maps. First death means the other team got the first kill.
| Team | Rounds | Share of opening duels won | Round win after first kill | Round win after first death |
|---|---|---|---|---|
| 9z | 2,266 | 49.6% | 70.5% | 27.2% |
| Aurora | 3,802 | 51.5% | 72.3% | 29.1% |
| BetBoom | 2,598 | 49.5% | 75.3% | 26.9% |
| FURIA | 5,049 | 52.3% | 75.0% | 29.2% |
| FUT | 3,300 | 50.7% | 74.4% | 29.1% |
| G2 | 4,064 | 50.0% | 73.2% | 29.8% |
| Legacy | 3,316 | 52.6% | 72.2% | 27.4% |
| Liquid | 2,178 | 49.0% | 70.8% | 24.5% |
| MOUZ | 4,166 | 51.3% | 74.7% | 31.4% |
| Natus Vincere | 3,794 | 52.7% | 71.8% | 29.3% |
| Spirit | 3,967 | 53.4% | 75.4% | 31.1% |
| The MongolZ | 3,603 | 48.7% | 72.7% | 29.5% |
| TYLOO | 1,806 | 46.8% | 70.9% | 24.1% |
| Vitality | 4,415 | 54.0% | 77.0% | 32.9% |
The spread looks narrow, 46.8% to 54.0%, and each team's share has a margin of 1.6 to 2.6 points. On that basis five teams, Vitality, Spirit, Natus Vincere, Legacy and FURIA, are above an even split by the usual 95% margin, and TYLOO is below it. With 16 teams checked at once, about one could clear it by luck. Vitality and Spirit are the most solid results: they stay clear even when we tighten the test to allow for 16 checks. The two win-rate columns are noisier, with margins of 1.7 to 3.4 points, so most gaps between teams in them are inside the noise.
Two teams in the field, Nemiga (839 rounds) and DENDELE (537), have too few S- and A-tier rounds in the window to list fairly, with margins of 3.6 to 5.9 points, so they are left out; every team in the table has at least 1,806. These are records, not forecasts: they describe how each team's past rounds went, against whoever they happened to play. For the season-long picture, see the CS2 team rankings.
Pull the numbers yourself
Every round row in the API carries first_kills, first_deaths, trade_kills, team_side and won, one row per team per round. This uses our official Python client (pip install esportsodds) to compute the opening-duel win rate for one event, the Esports World Cup 2026:
from esportsodds import Client

EWC_2026 = "019f23d2-5a32-71d0-ac4b-dfc7eb5dd3f0"  # tournament id

client = Client()  # reads ESPORTSODDS_API_KEY from the environment
won = total = 0
for match in client.matches.iter(tournament=EWC_2026, status="completed", has="rounds"):
    for row in client.matches.rounds(match["id"]):
        if row["first_kills"] == 1:
            total += 1
            won += row["won"]

print(f"{won / total:.1%} of {total} rounds won by the team with the first kill")
On 2 November it printed 70.5% of 2459 rounds won by the team with the first kill. One event is a small sample, so expect that figure to move more than the whole-year one. Group by team_side, by map (from the match's map results) or by equipment_value and you can rebuild the same kind of tables; the exact figures above also need the S- and A-tier filter and the clean-round rules. The script makes 57 requests for the whole event: one page of matches, then one call for each of the 56 matches that carry round data.
Start free with a sandbox key: a fixed sample of past matches, no card.
Cite this
EsportsOdds, "CS2 opening duels: first-kill teams win 72% of pro rounds", 2 November 2026. https://esportsodds.gg/learn/cs2-opening-duels