Bottom line: Down 3-9 at the half, a professional CS2 team wins the map 9.9% of the time. From 4-8 it is 19.8%, from 5-7 34.2%, and a 6-6 tie is exactly even. Two things move those numbers more than the scoreline suggests: the side you played first (a level 6-6 is 53.5% for the team that started on T, 46.5% for the team that started on CT) and the second-half pistol round, which from 3-9 down lifts the comeback rate from 6.4% to 21.0%. Every figure here is computed from the EsportsOdds CS2 data API across 30,712 decided maps (as of 19 July 2026).
The halftime curve
Counter-Strike splits a map into two 12-round halves, and the teams swap sides at the break. That makes the halftime score the most informative single checkpoint on a map: half the rounds are gone, and the conditions are about to invert.
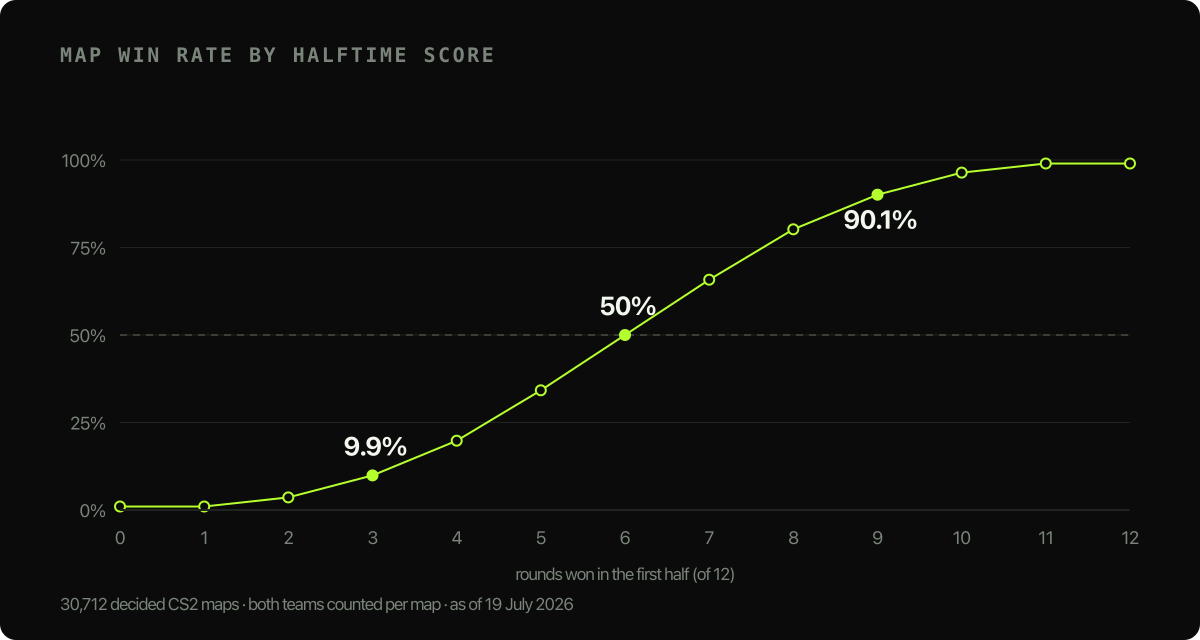
Across 30,712 decided professional maps from 14,270 matches, this is how each halftime score converts into a map win:
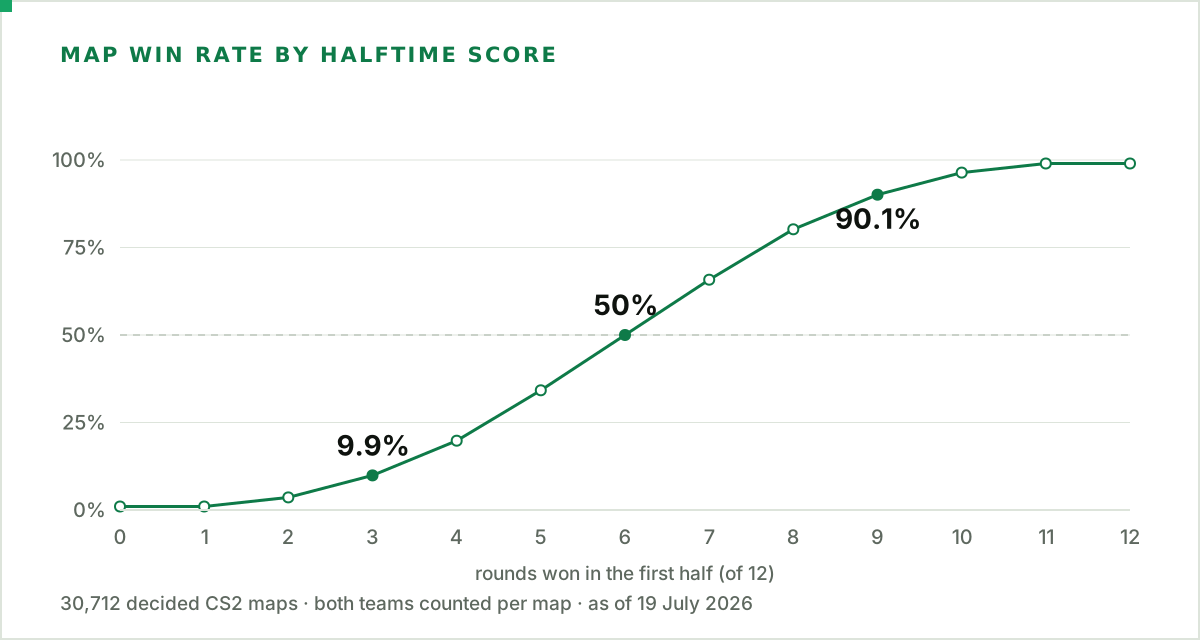
The shape is a clean S-curve, and it is symmetric by construction: every map contributes both teams, so 3-9 at 9.9% is the mirror of 9-3 at 90.1%, and 6-6 lands on exactly 50.0%. That symmetry is a check that the arithmetic is right, not a finding.
The finding is how shallow the middle is. A two-round halftime lead converts only 65.8% of the time. Even a four-round lead at 8-4 loses one map in five. Between 5-7 and 7-5 the map is much closer to a coin flip than the scoreboard implies, and commentary that treats a 7-5 half as "control" is describing a two-in-three shot.
The same score is not the same position
Halftime scores get quoted as if they were self-contained. They are not. A team that spent the first half on the T side is about to defend on CT, the stronger side on most of the active-duty map pool. The same number on the scoreboard describes two different situations.
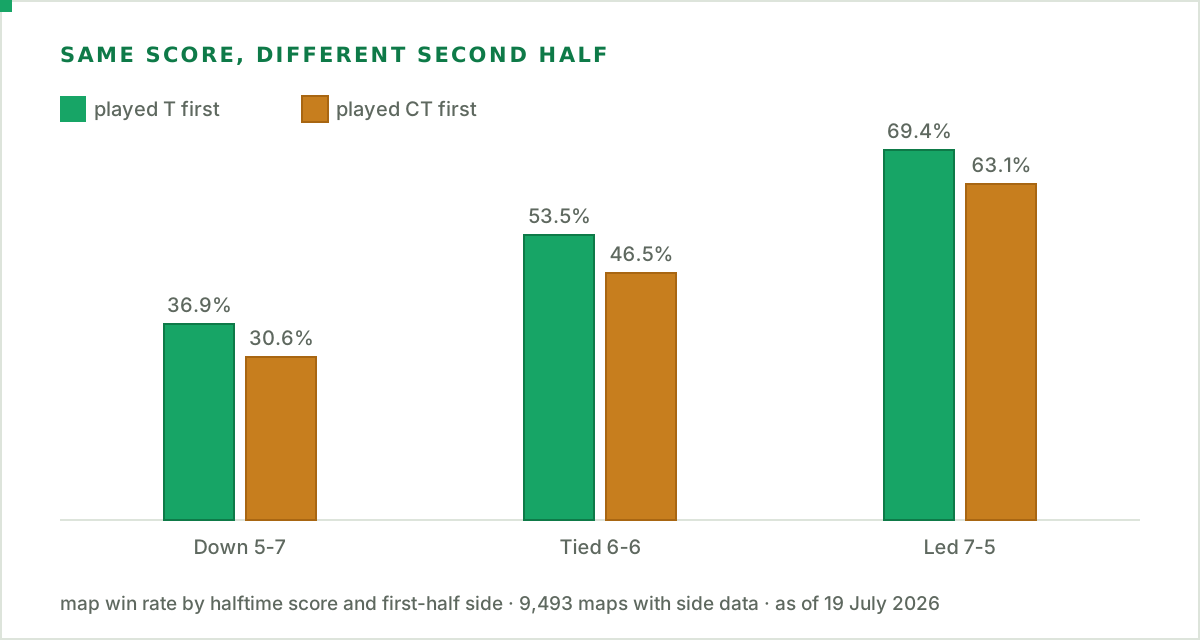
From a level 6-6, having played the T side first is worth about seven percentage points: 53.5% against 46.5%. The gap holds at 5-7 (36.9% vs 30.6%) and at 7-5 (69.4% vs 63.1%), which is what you would expect from a real structural advantage rather than noise in one bucket. A team down 5-7 that is about to switch to CT is in materially better shape than the identical score in the other direction.
The second-half pistol is the largest lever a trailing team has
The pistol round that opens the second half is the first round played under the new sides, and both teams enter it on an identical minimal buy. Splitting the comeback rate by who won that single round produces the sharpest split in the whole dataset:
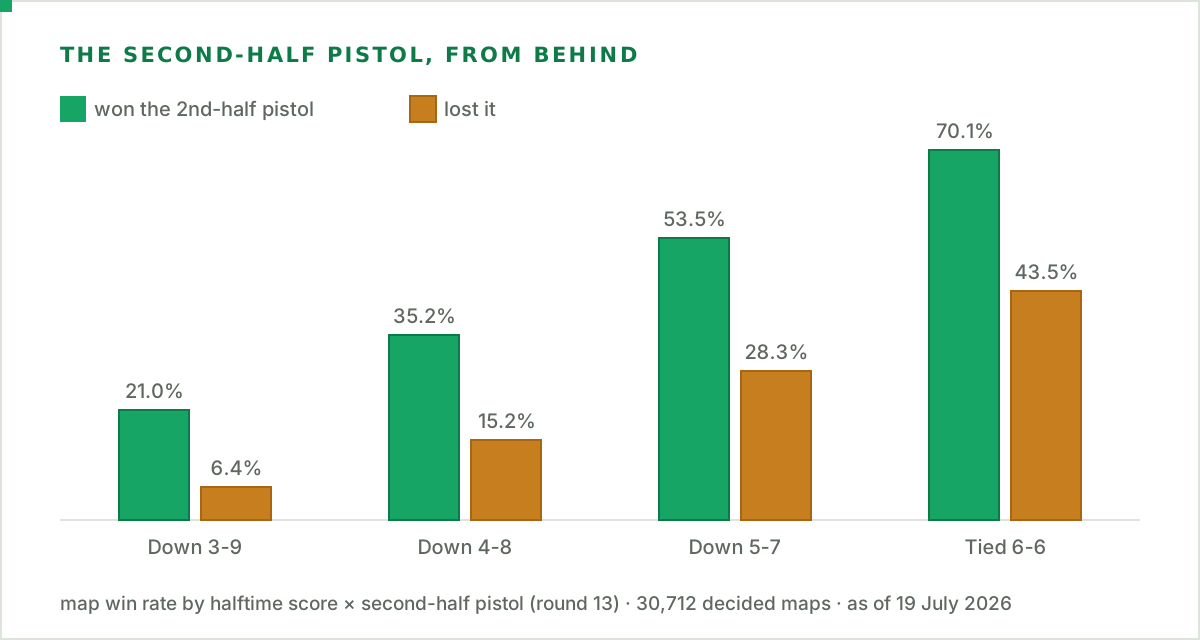
From 3-9 down, winning the second-half pistol lifts the comeback rate from 6.4% to 21.0%, more than three times. The pattern repeats at every deficit: 4-8 goes from 15.2% to 35.2%, 5-7 from 28.3% to 53.5%. A team trailing 5-7 that wins the pistol is no longer an underdog at all.
This sharpens rather than contradicts the usual "pistols are overrated" correction. Across all maps, winning a pistol round leads to a map win only 56.6% of the time. But conditional on being behind, that one round is the difference between a one-in-sixteen recovery and a one-in-five one. The pistol matters most exactly when a team can least afford to lose it.
Why the middle of the curve is so shallow
Two mechanics flatten the middle. The first is the economy: the loss bonus pays a trailing team more the longer it struggles, so the side that got buried arrives in the second half better funded. That effect is real but smaller than folklore suggests — teams that won four rounds or fewer in the first half average $18,433 of equipment across rounds 14 to 16, against $17,983 for teams that led by seven or more. About $450, or 2.5%. It nudges; it does not rescue.
The second is that Counter-Strike rounds are won by man-advantage far more than by money:
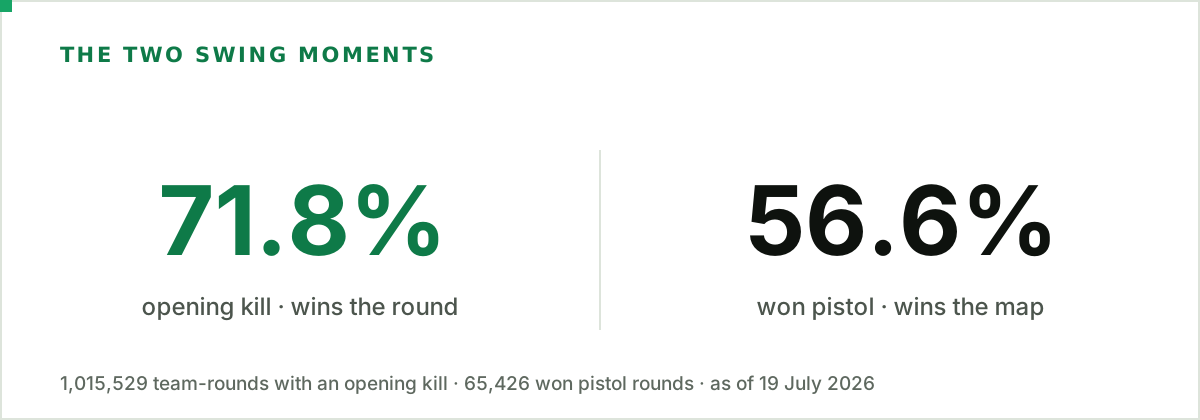
The opening kill is worth 71.8% of the round across more than a million team-rounds. A 5v4 in Counter-Strike is close to decisive, which is why entry fraggers are valued out of proportion to their raw kill counts, and why a trailing team with a full buy and a good first duel can string rounds together quickly.
Three years, one number
The comeback rate has been almost perfectly stable since CS2 launched:
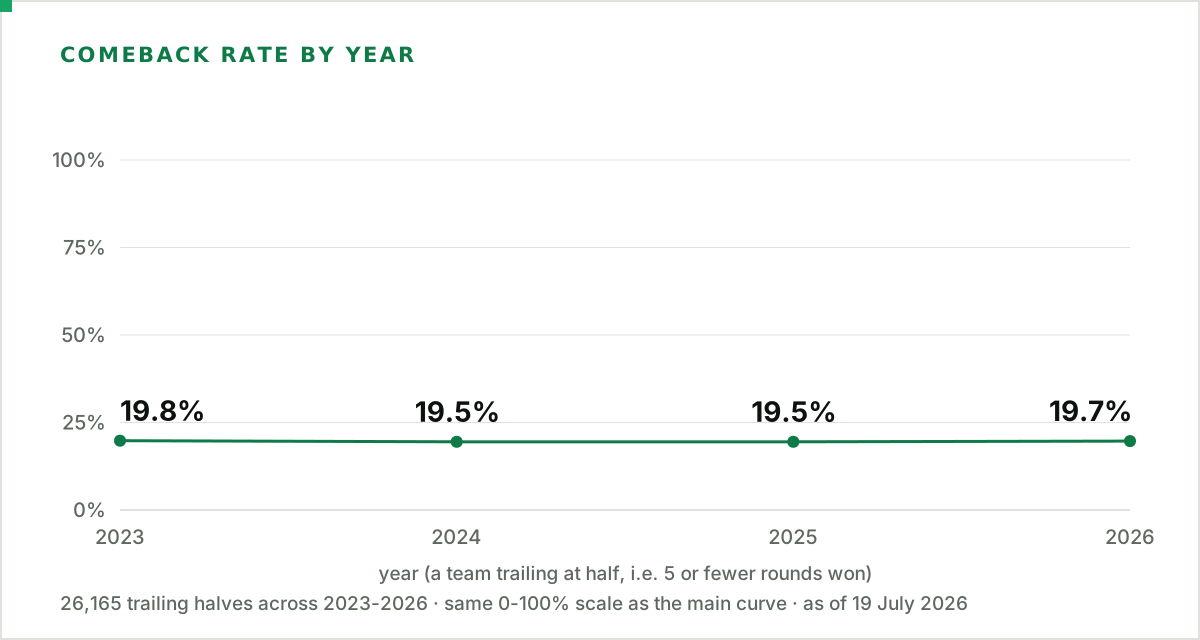
19.8%, 19.5%, 19.5%, 19.7%. Three years of roster churn, map-pool rotations and balance patches have moved the number by less than half a point. That points at the format itself (12-round halves, the side switch, the loss bonus) rather than at any particular meta. It also makes the figure a reasonable prior to carry into a live model rather than something to re-fit every season.
Map matters, but less than you would think
Splitting comebacks by map produces a spread, though a modest one:
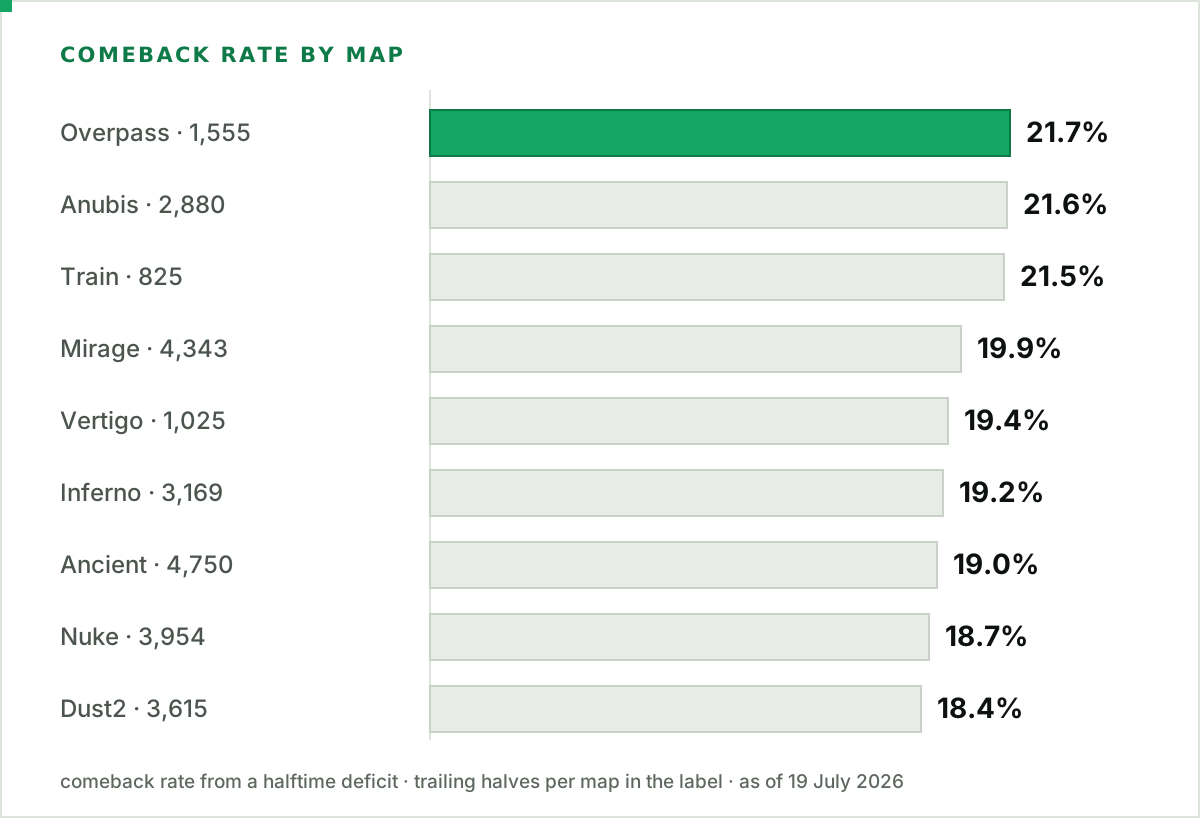
The whole pool sits inside an 18–22% band. Overpass (21.7%) and Dust2 (18.4%) sit at the ends, but with 1,555 and 3,615 trailing halves respectively those two are only marginally separable, and the maps in the middle are not separable from each other at all. The honest reading is that map identity is a second-order effect next to the score and the side: worth including as a feature, not worth building a narrative on.
How maps actually end
Comebacks do not usually arrive via overtime. Overtime is reached on 11.9% of decided maps overall, and the deeper the deficit, the less likely it becomes:
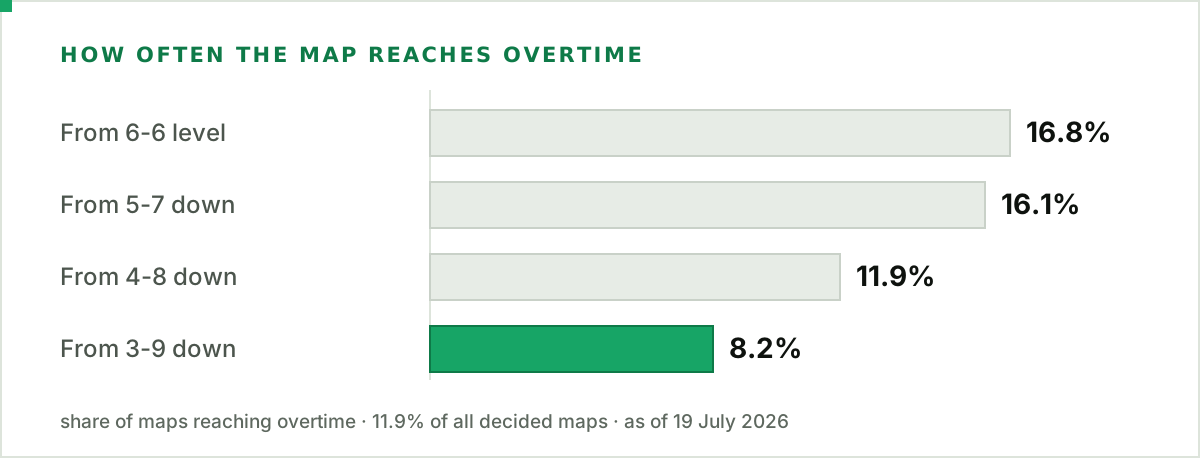
From 3-9 down only 8.2% of maps reach overtime, against 16.8% from a level half. A team six rounds behind has to win outright, not merely draw level, and the same deficit that makes a comeback unlikely also makes the tidy overtime finish unlikely. Close halves, not distant ones, are what produce overtime.
One level up: the best-of-three
The same question at series level has a cleaner answer:
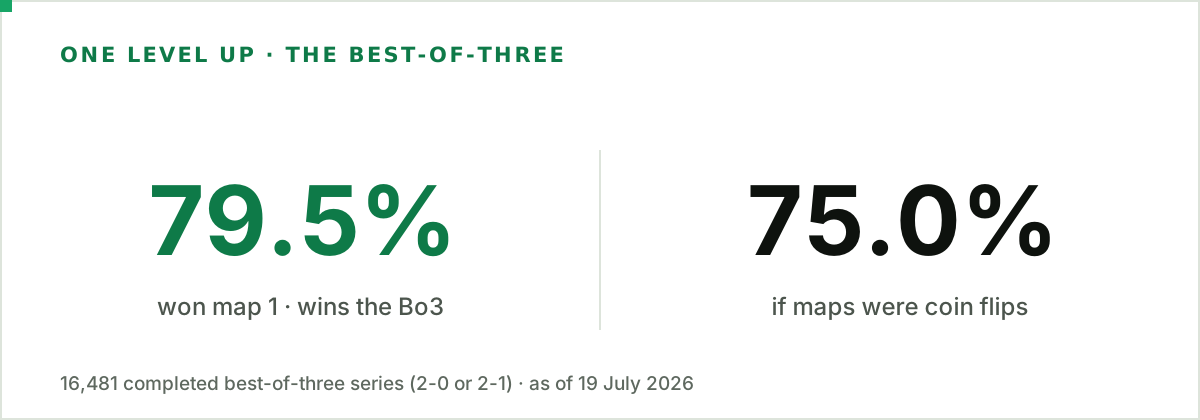
Across 16,481 completed best-of-three series, the team that wins map one takes the series 79.5% of the time. That sounds decisive until you note the baseline: if the maps were independent coin flips, winning map one would already win the series 75% of the time, because the leader then needs only one win from two. The real informational content of a map-one win is the 4.5-point excess over that baseline — the part attributable to one team genuinely being better, or carrying momentum. Most of the apparent dominance is just the format.
What this means if you are modelling it
Four things fall out of the data for anyone building a CS2 model, a live scoreboard, or a fantasy tool:
- A halftime score alone is an incomplete feature. Pair it with the side the team is about to play. The seven-point swing at 6-6 is larger than the gap between several adjacent scorelines.
- The second-half pistol deserves its own term. It is the largest single in-map conditional in this dataset, and its effect is strongest where the base rate is lowest.
- The tails are steep, the middle is flat. A model that treats the halftime score linearly will misprice both ends badly.
- Don't over-fit to the season. The aggregate rate has not moved in three years; map identity moves it by a couple of points at most.
How this was calculated
Every number comes from per-map and per-round rows in the EsportsOdds CS2 data API. The sample is 30,712 decided maps from 14,270 professional and semi-professional matches (ESL Pro League, ESL Challenger League, YaLLa Compass, Elisa Invitational and others), played between October 2023 and July 2026, the CS2 era.
Three filters shape it. Only MR12 maps are included, so the first half always totals 12 rounds; this excludes the older MR15 format. Drawn maps are excluded, since a drawn map has no winner to predict. And the first-half-side split covers the 9,493 maps where the starting side is recorded, so that chart rests on a smaller sample than the main curve.
Two details are worth stating because they are easy to get wrong. Overtime fields are empty rather than zero when a map ended in regulation, so a naive average over them reports every map as an overtime map. And the second-half pistol is round 13 under MR12, not round 16 as it was under MR15; mixing the two formats silently corrupts the split. Our methodology page documents how map and round records are assembled.
Down 3-9 at the half, professional CS2 teams win about one map in ten; down 5-7 it is a third. The side you played first is worth roughly seven points on top of the score, and winning the second-half pistol is worth far more than that — from 3-9 it more than triples the recovery rate.
Frequently asked questions
How often do CS2 teams come back from 3-9 down?
About 9.9% of the time, roughly one map in ten, across 30,712 decided professional CS2 maps. From 4-8 the recovery rate is 19.8%, and from 5-7 it is 34.2%.
Does winning the second-half pistol matter?
More than any other single round. From 3-9 down, teams that win the second-half pistol recover 21.0% of the time versus 6.4% when they lose it. From 5-7 down it is 53.5% versus 28.3%, which moves a trailing team from well behind to better than even on the map.
Is a 6-6 halftime score really even?
On the raw curve, yes: exactly 50.0%. Split by which side each team played first, the team that opened on T wins 53.5% and the team that opened on CT wins 46.5%, because the T-first team defends on the usually stronger CT side after the switch.
Which CS2 map sees the most comebacks?
Overpass, at 21.7% from a halftime deficit, with Anubis and Train just behind. Dust2 is lowest at 18.4%. The entire active pool sits in a narrow 18–22% band, so map identity matters much less than the score or the side.
How much is the opening kill worth in CS2?
The team that scores a round's opening kill wins that round 71.8% of the time, measured across 1,015,529 professional team-rounds. The man advantage early in a round is close to decisive.
Does winning map one win the best-of-three?
79.5% of the time across 16,481 series. Because the format alone would give 75% if maps were coin flips, the genuine signal in a map-one win is smaller than it looks.
Where can I get CS2 round and map data?
Through the EsportsOdds CS2 data API, which exposes per-map half scores and per-round team records as JSON. Every figure on this page can be rebuilt from those rows.