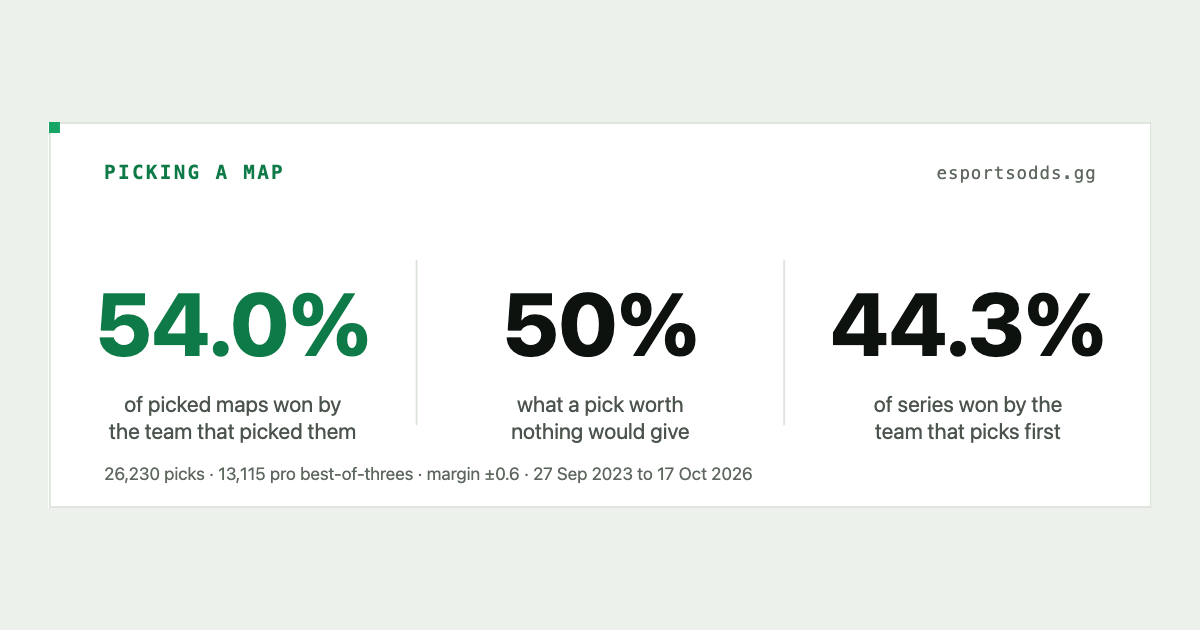
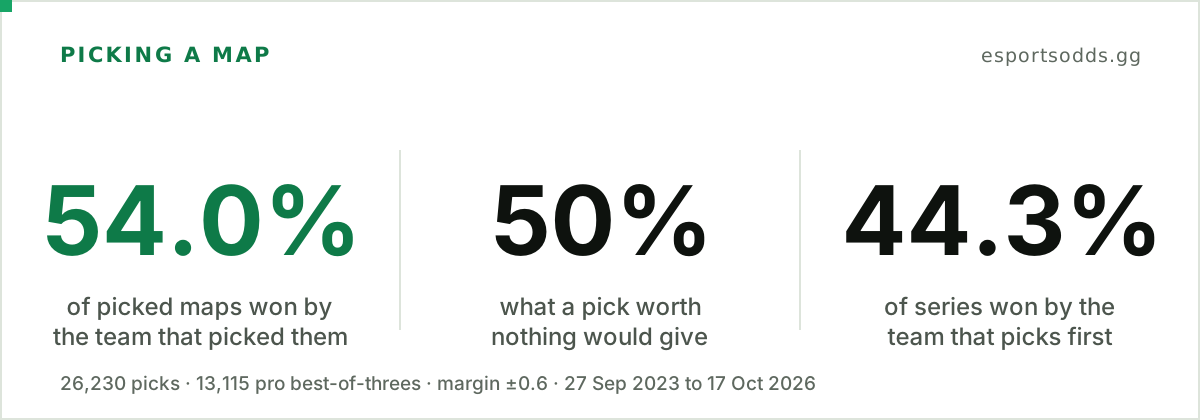
Bottom line: Yes, a little. In a professional CS2 best-of-three each team picks one map, and across 13,115 series since the CS2 launch the picking team won 54.0% of its picked maps (14,154 of 26,230, 95% margin 53.4% to 54.5%). Because every series has exactly one pick per team, team strength cancels out and an even split would be 50%, so a pick is worth roughly four points. The number is steady across event tiers and years. The first pick of a series wins 49.4% and the second 58.5%, but the team that picks first is usually the weaker side, so most of that split is team strength rather than pick order. The veto and map results behind every figure are in the CS2 data API.
What we counted
A best-of-three veto runs ban, ban, pick, pick, ban, ban, with the last map left over as the decider. Each team therefore makes one pick. The first pick was played as map 1 and the second as map 2 in 13,082 of the 13,115 series we kept.
Veto records exist for 13,676 of the 15,983 completed best-of-threes since the CS2 launch on 27 September 2023. We kept the 13,115 where there were exactly two picks, one by each team, and both picked maps were played out to a result. The other 561 were set aside: 364 where a picked map was not played out, 184 with no result row for a picked map, 12 without exactly two picks and 1 without one pick per team. That is about 4% of the series with a pick record. We have not shown that the set-aside series are unrelated to who won the picked maps, so every figure below describes the series that were played out and recorded in full.
Why 50% is the line
Picks come in pairs, which gives the test a useful property. Suppose team A is the stronger side and wins any given map with probability p against team B. Then A wins its own pick with probability p, and B wins its own pick with probability 1 minus p. Across the pair the picking teams win one map on average, whatever the gap between the teams. If picking gave nothing, the pooled rate would average 50% however lopsided the matchups. A pick advantage can only show up as more than 50%.
| Picked maps | Won by the team that picked them | 95% margin |
|---|---|---|
| 26,230 (13,115 series) | 54.0% (14,154) | 53.4% to 54.5% |
In 24.4% of series both teams won their own pick, and in 16.5% neither did. Resampling whole calendar months, which allows for a stretch of time that runs hot or cold, gives 53.3% to 54.6%.
The veto predictability study found the same 54.0% when it counted every pick with a result, so two different cuts of the data agree. What this article adds is why 50% is the right line, and the splits by tier, year and pick order.
By tier and by year
| Event tier | Series | Picker won their pick | 95% margin |
|---|---|---|---|
| S | 1,903 | 53.5% | 52.1% to 55.0% |
| A | 866 | 53.9% | 51.7% to 56.1% |
| B | 9,314 | 54.1% | 53.5% to 54.8% |
| C | 1,032 | 53.3% | 51.3% to 55.3% |
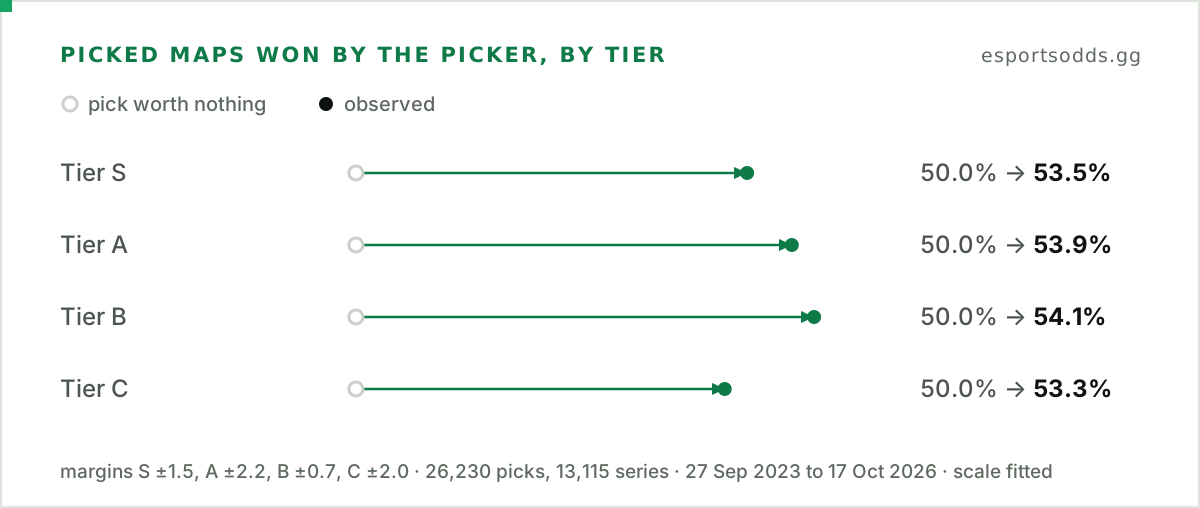
By year it is the same: 53.1% in 2023 (from 27 September, 866 series), 54.2% in 2024 (2,824), 54.2% in 2025 (4,136) and 53.8% in 2026 so far (5,289). The advantage from picking is a few points at every level of play, and the margins for the top tier overlap those of the rest. The two splits are not independent: all 1,032 tier C series are from 2026, so a tier effect and a year effect cannot be told apart for them.
The first pick and the second pick
| Pick | Won by the team that made it | 95% margin |
|---|---|---|
| First pick (map 1) | 49.4% | 48.6% to 50.3% |
| Second pick (map 2) | 58.5% | 57.6% to 59.3% |
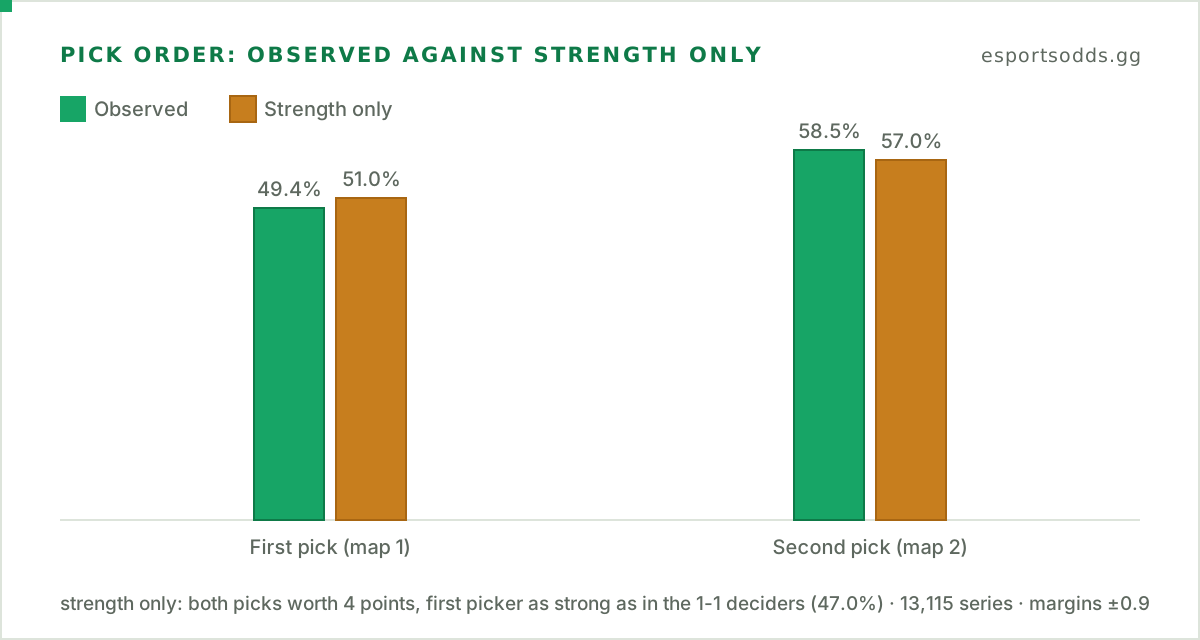
That gap looks like a big advantage for picking second, with the opponent's pick already on the table. Most of it is something else. The team that picks first wins only 44.3% of series, so across this data it is the weaker side on average, which is why its pick wins less often than the reply. The 1-1 deciders give a second read on strength, because neither team picked that map: the first picker won 47.0% of the 5,211 of them (margin 45.6% to 48.4%). If both sides gained the same four points from picking and only strength differed, the two rows would be about 51.0% and 57.0%, a 6-point gap against the 9.1 observed. So strength accounts for roughly two thirds of the split, and the remaining three points could be a pick-order effect or something else; this data cannot separate them. The pooled 54.0% does not have that problem, because each series contributes one pick from each side.
What this does not tell you
A pick is a choice, not a handicap. The four points are teams choosing maps they are good on, and the data does not say what drives it: knowing the map, preparation or the format around a pick. A pick is also the end of a veto, so the four points include the bans that shaped the pool the pick came from, not the pick alone. It describes past series and says nothing about the next one. The margins use the series as the unit, which already accounts for the two picks in one series being linked, but the same teams appear many times, so they are slightly optimistic.
Compute it yourself
Both the maps and the vetoes are on the match records where we hold them. With the Python client (pip install esportsodds), the bulk route returns 25 matches a page:
from datetime import date, timedelta

from esportsodds import Client

client = Client()  # reads ESPORTSODDS_API_KEY from the environment
since = (date.today() - timedelta(days=7)).isoformat()  # a week is under a dozen bulk pages


def winner_team(match, m):
    """Id of the team that won map m, or None if it was not played out (a null status counts as played)."""
    played = m["status"] in (None, "played") and max(m["score_a"], m["score_b"]) >= 13
    if not played or m["score_a"] == m["score_b"]:
        return None
    return match["team_a_id"] if m["score_a"] > m["score_b"] else match["team_b_id"]


series = picker_wins = 0
for match in client.matches.iter_bulk(
    include="maps,vetoes", has="vetoes", status="completed", date_from=since, limit=25
):
    if match["format"] != "bo3":
        continue
    picks = [v for v in sorted(match["vetoes"], key=lambda v: v["order"]) if v["choice_type"] == "pick"]
    if len(picks) != 2 or picks[0]["team_id"] == picks[1]["team_id"] or picks[0]["map_name"] == picks[1]["map_name"]:
        continue
    maps = {m["map_name"]: m for m in match["maps"]}
    won = [winner_team(match, maps[v["map_name"]]) if v["map_name"] in maps else None for v in picks]
    if None in won:
        continue  # a picked map has no result row or was not played out
    series += 1
    picker_wins += sum(w == v["team_id"] for w, v in zip(won, picks))

print(f"The picking team won {picker_wins} of {2 * series} picked maps ({picker_wins / (2 * series):.1%}) in {series} best-of-threes")
The status rule follows the API reference: a null map status means the source did not say, and should be read as played. A week holds only about 150 picks today, so expect a rate that wanders several points either side of 54% rather than the table's figure. Each page counts as one bulk-export request, and the 14-day money-back guarantee on a first subscription holds only while an account has made fewer than 1,000 requests and no more than 20 bulk-export requests since its first payment, so the week above stays inside it. Setting since = "2023-09-27" reads the whole history of matches with veto records, 15,882 matches or 636 pages, and gives about 54%; run that only once you no longer need the guarantee. For what a veto is and how the pool is picked down, see the map veto entry and the most banned and picked maps, and the map win rates show how much the map itself moves a result. For what the opening map means for a whole series, see the map 1 study.
Frequently asked questions
Do CS2 teams win the maps they pick?
A little more than half the time. Across 26,230 picks in 13,115 professional best-of-threes, the picking team won 54.0%, with a 95% margin of 53.4% to 54.5%.
Is picking a map an advantage in CS2?
About four points, measured in a way that cancels team strength. It is similar at every event tier and in every year since the CS2 launch.
Does the first pick win more than the second?
No, less: the first pick won 49.4% and the second 58.5%. Most of that gap is strength, because the team that picks first wins only 44.3% of series and 47.0% of the 1-1 deciders neither team picked. That leaves about three points this data cannot tell apart from a pick-order effect.
Where do these numbers come from?
From the veto and map results in the EsportsOdds CS2 data API, as of 18 October 2026. They describe past series and say nothing about the next one.
Cite this
EsportsOdds, "Do CS2 teams win the maps they pick? 26,230 pro picks", 18 October 2026. https://esportsodds.gg/learn/cs2-pick-win-rate