CS2 pistol rounds: first-pistol winners win 59.5% of maps
, 13 min read
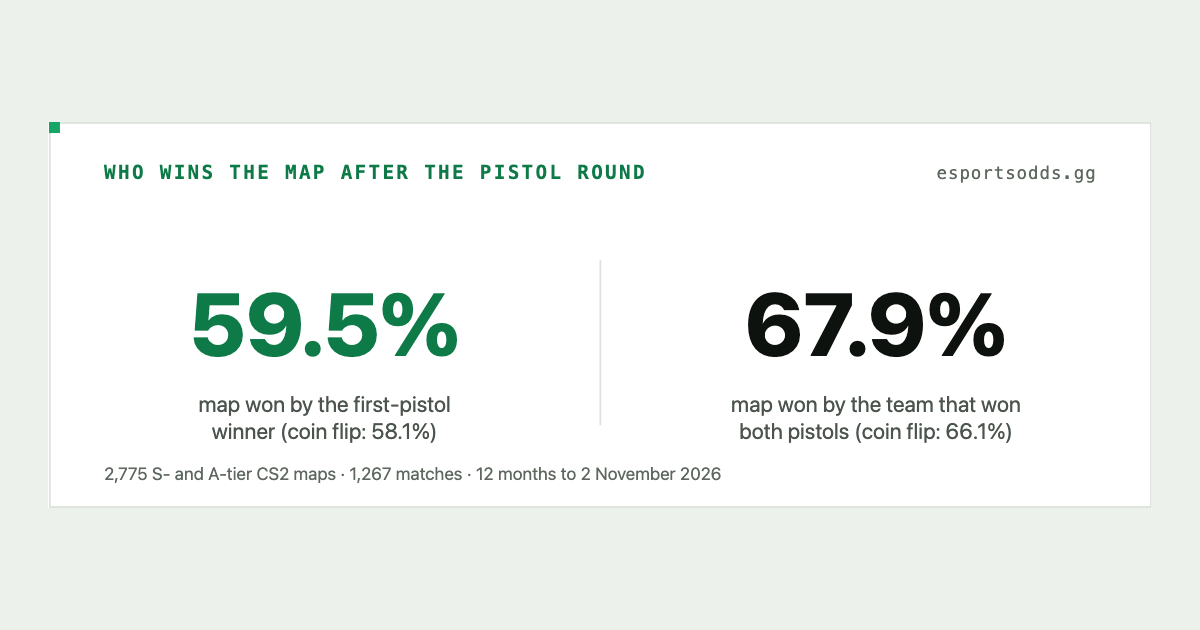
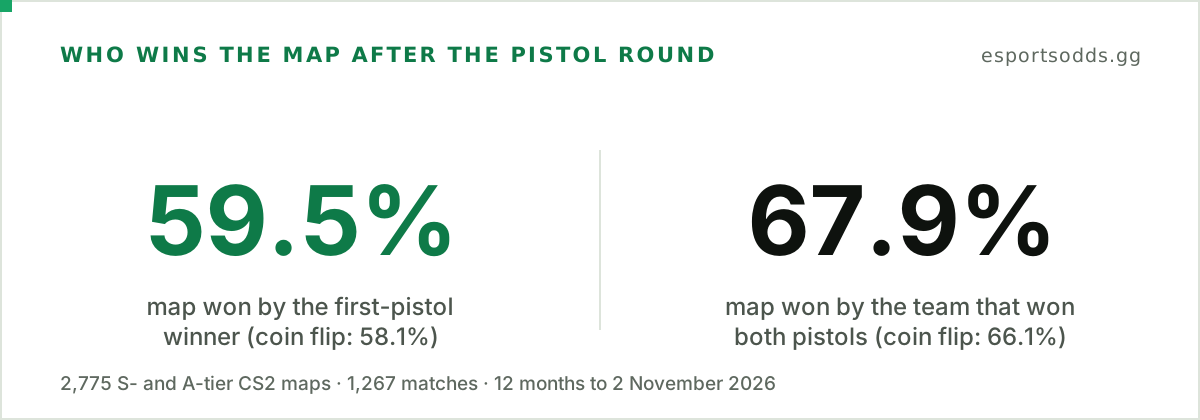
Bottom line: Across 2,775 CS2 maps from S- and A-tier events over the past 12 months, the team that won the first CS2 pistol round went on to win the map 59.5% of the time, and a team that won both pistols won it 67.9%. That is close to what one round is worth in a race to 13 rounds: if every round were a coin flip, the figures would be 58.1% and 66.1%. The clearest link is the round after the pistol, which its winner took 81.1% of the time, and 96.9% when the other team saved its money. All figures are as of 2 November 2026, and round-by-round data like this is available through the CS2 data API from EsportsOdds.
Does the team that wins the first pistol round win the map?
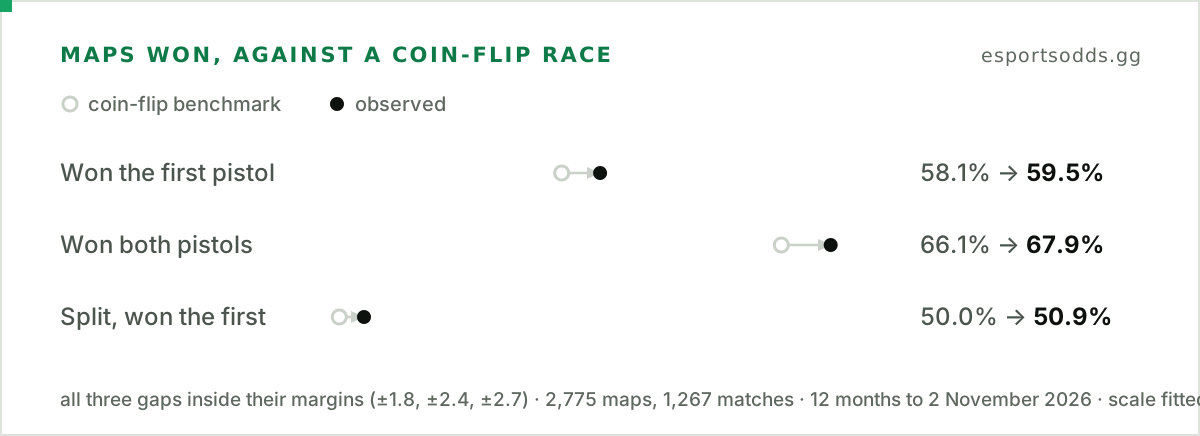
More often than not: the team that won the first pistol round took the map 59.5% of the time, and the team that lost it took the other 40.5%. That is close to what one round is worth in a race to 13: if every round were a fair coin flip, a team that had won one round would still win the map 58.1% of the time (we worked this out exactly).
A pistol round is the first round of each half, round 1 and round 13. Both teams start it with the same money, so neither has a gear edge. We used completed matches from tier S and tier A events, the two highest tiers in our data, played in the 12 months before 2 November 2026. Only maps whose round record passes our checks count: 2,775 maps from 1,267 matches, holding 60,360 rounds. Of the 2,816 maps that have round records, we drop 41 (1.5%). In 12 of them the pistol flag sits on the wrong round, and in 29 the round record is incomplete or does not match the stored result.
Rounds inside a map depend on each other, and so do the maps of a series, because one pair of teams plays them all. So each match counts once when we work out a margin. On that basis the 59.5% has a 95% margin of 1.8 points: the true rate is very likely within 1.8 points of it. We call a gap clear when it beats its own margin, and inside the noise when it does not.
How big is 59.5%? A map is a race to 13 rounds, with overtime at 12 all. Winning the first round puts a team one round up. The first pistol sits 1.4 points above the coin-flip figure, margin 1.8, which puts it inside the noise. The winner of the second pistol, round 13, won the map 58.6% of the time. A pistol round looks worth about one round.
Our comebacks study quotes 56.6% for a team that wins a pistol round, across a broader set of pro maps. It counts a team once per map, so a team that won both pistols counts once. The same count on the maps here is 56.0% (margin 0.9), against 55.4% for coin flips. That study also looks at a team that trails at half time and the pistol that opens the second half, a narrower question than the one here.
Treat these figures as a record of past maps, not a prediction for any match, and the coin-flip figures as arithmetic about a race to 13, not a model of CS2. The money from a pistol win carries into the next rounds, and a better team may take both the pistol and the map for one reason. The sections below look at both.
What if a team wins both pistols, or only one?
In 50.5% of maps (1,400 of 2,775) the same team won both pistols. In the other 1,375 maps each team won one. Counting each map once for each team gives 5,550 team results:
| The team won | Team results | Won the map | Coin-flip benchmark |
|---|---|---|---|
| Both pistols | 1,400 | 67.9% (±2.4) | 66.1% |
| One pistol | 2,750 | 50.0% | 50.0% |
| No pistol | 1,400 | 32.1% (±2.4) | 33.9% |
A team that won both pistols won the map 67.9% of the time. That is 1.8 points above the coin-flip figure (margin 2.4), which is inside the noise. A team that won one pistol wins exactly half of those maps, by arithmetic: the other team won one too, and one of the two has to win the map. When the pistols split, the winner of the first one took the map 50.9% of the time (margin 2.7). The first pistol had no clear edge over the second.
What happens in the round after a pistol?
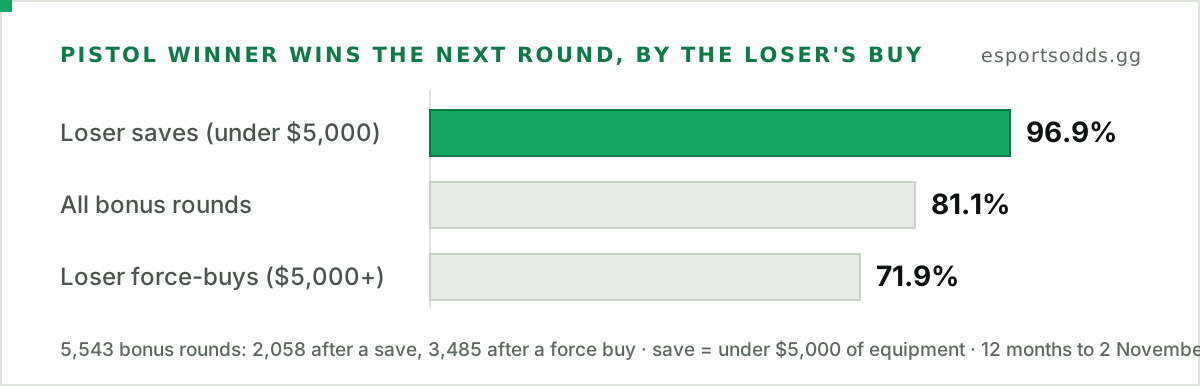
The round after a pistol is the bonus round, round 2 or round 14. Across 5,543 of them (2,775 in round 2 and 2,768 in round 14, because 7 maps ended 13 to 0), the pistol winner won 81.1% (margin 1.1).
The biggest split is in what the losing team does with its money. We call it a save when the team that lost the pistol has under $5,000 of equipment in the bonus round, and a force buy when it has $5,000 or more. Only 113 of the 5,543 bonus rounds are at $5,000 or more but under $9,000, so the line is not delicate. Teams save in 37.1% of bonus rounds. After a save, the pistol winner won 96.9% (2,058 rounds). After a force buy it won 71.9% (3,485 rounds), so the other team won more than one in four of these rounds. For how these buys work, see the CS2 economy guide, eco round and force buy.
The pistol winner does better as a CT, 84.4% (margin 1.3) against 77.7% (margin 1.6) as a T. The gap follows the other team's buy. A T team that has lost the pistol saves in 51.7% of bonus rounds. A CT team that has lost it saves in 22.0%. With the same buy the two sides are inside the noise of each other: after a save the pistol winner won 97.0% as a CT and 96.7% as a T, and after a force buy 71.0% and 72.4%.
In the first half, a pistol winner that also won round 2 went on to win the map 64.2% of the time (2,242 maps, margin 1.9). That is 1.9 points under the 66.1% a two-round lead gives when rounds are coin flips, which is inside the noise, but only just. So the bonus-round edge does not show up as a map rate above what a two-round lead gives. The 533 pistol winners that lost round 2 won only 39.8% of their maps (margin 4.0), clearly under the 50.0% that one round each gives. This is an association. The pistol loser that wins the bonus round may simply be the better team on that map.
Do CTs or Ts win more pistol rounds, and does the map matter?
Neither side has a clear edge. CTs won 50.9% of the 5,550 pistol rounds (margin 1.3). Being 0.9 points from an even split is within the noise. The CS2 map win rates study shows the same shape over pro pistol rounds as a whole, 50.3% CT and 49.7% T. The map does not change that clearly either. The CT column is set against an even split, and the last column against the 58.1% coin-flip figure:
| Map | Maps | CT share of pistol wins | First-pistol winner won the map | In the pool now |
|---|---|---|---|---|
| Dust2 | 527 | 52.9% (±3.0) | 57.3% (±4.2) | Yes |
| Mirage | 511 | 52.3% (±3.0) | 58.1% (±4.3) | Yes |
| Ancient | 437 | 50.2% (±3.2) | 58.4% (±4.6) | Yes |
| Inferno | 395 | 47.7% (±3.7) | 62.8% (±4.8) | Yes |
| Nuke | 383 | 52.6% (±3.6) | 59.0% (±4.9) | Yes |
| Overpass | 173 | 51.7% (±5.1) | 64.2% (±7.2) | No |
| Anubis | 167 | 45.8% (±5.2) | 63.5% (±7.3) | Yes |
| Cache | 151 | 48.7% (±5.6) | 58.3% (±7.9) | Yes |
No map is clear in either column. Inferno comes closest to clear in the last column (62.8%, 4.7 points above the coin-flip figure against a margin of 4.8). Dust2 comes closest to clear on the CT side, and Anubis has the lowest CT share. All three are inside their margins. With 16 checks (eight maps, two columns), about one could pass its margin by chance. The table lists 2,744 of the 2,775 maps. The rest are 30 maps on Train (out of the pool now) and 1 on a map with too few games to show. Overpass left the pool in July 2026 and Cache joined it, and Anubis joined it in January 2026 when Train left, so those maps cover only part of the window (see the map pool study).
Is the pistol link just team strength?
Better teams win more maps, so some of the link could be strength. We checked it with our own team ratings (see our team rankings), as they stood before each match. Of the 2,775 maps, 2,762 have a rating for both teams, and in 3 of those the two ratings are within 0.1 of each other. We split the other 2,759 by how far apart the two ratings were:
| Rating gap before the match | Maps | Higher-rated team won the map | Higher-rated team won the first pistol | First-pistol winner won the map |
|---|---|---|---|---|
| Under 50 | 998 | 52.4% (±3.2) | 52.0% (±3.2) | 59.9% (±3.0) |
| 50 to 99 | 727 | 60.5% (±3.8) | 53.0% (±3.7) | 59.7% (±3.5) |
| 100 to 149 | 487 | 65.3% (±4.4) | 52.2% (±4.5) | 62.2% (±4.4) |
| 150 or more | 547 | 72.2% (±3.9) | 51.4% (±4.0) | 56.1% (±4.1) |
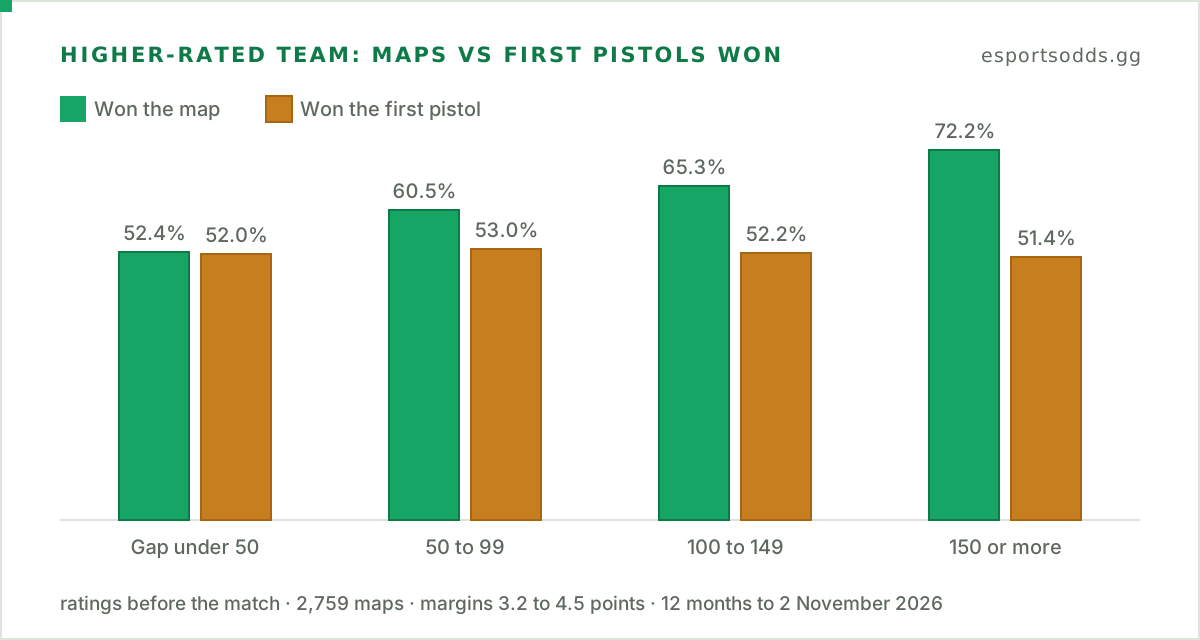
The ratings do their job: the higher-rated team won the map more often as the gap grew, from 52.4% to 72.2%. The first pistol hardly moved. The higher-rated team won it 52.2% of the time overall (margin 1.9), which is 2.2 points above an even split: clear, but only just. The first-pistol winner's map rate did not climb with the gap either. It was 59.9% when the two teams were closely matched, about the same as the 59.5% overall. So the table gives no sign that the link grows with team strength. The ratings are ours and imperfect, though: closely matched means closely matched on them, and a pistol winner can still be the better team on the day.
A pistol is also a weaker clue than an ordinary round. If every round were a coin flip, the winner of any of the first 12 rounds would win the map 58.1% of the time. Across rounds 3 to 11, the team that won a given round went on to win the map 62.2% of the time (margin 0.7), which is about 4 points above that and clear. For a pistol it was 59.0% (margin 1.3). The 3.2-point gap between the two is clear. On the 2,759 maps with a rating gap, the higher-rated team won 54.2% of rounds 3 to 11 and 52.4% of pistols, a gap of 1.8 points against a margin of 1.5: clear, but only just.
Pull the numbers yourself
Each round comes back as two rows, one for each team, carrying map_number, round_number, team_id and won. The script below uses the official Python client (pip install esportsodds) to find how often the first-pistol winner took the map at one event, PGL Masters Bucharest 2026:
from collections import Counter, defaultdict

from esportsodds import Client

BUCHAREST = "01a0b9c5-7fd1-7ff0-b781-e776ab3abcd4"  # tournament id

client = Client()  # reads ESPORTSODDS_API_KEY from the environment
won = total = 0
for match in client.matches.iter(tournament=BUCHAREST, status="completed", has="rounds"):
    maps = defaultdict(list)
    for row in client.matches.rounds(match["id"]):
        maps[row["map_number"]].append(row)
    for rows in maps.values():
        wins = Counter(r["team_id"] for r in rows if r["won"])
        if not wins:
            continue  # no winner recorded for this map
        (winner, top), *rest = wins.most_common()
        first = [r["team_id"] for r in rows if r["round_number"] == 1 and r["won"]]
        if top < 13 or (rest and rest[0][1] == top) or len(first) != 1:
            continue  # not played out, or no clear first pistol
        total += 1
        won += first[0] == winner

print(f"{won / total:.1%} of {total} maps won by the team that won the first pistol round")
The run on 2 November printed 64.9% of 97 maps won by the team that won the first pistol round. Bucharest is one event, so 97 maps is a small sample: expect its figure to swing much more than the year's. The script sends 42 requests: the first lists the matches, and the other 41 fetch the rounds of each match that has them. It reads each map from its round rows alone, so it skips only maps with no winner on 13 rounds or no single first-pistol winner. A sample key reads only a fixed set of past matches, so run it with a full API key. To match the figures above exactly, also keep only tier S and A matches from the 12 months before the run, and drop maps whose pistol flag sits on the wrong round, whose sides do not swap at half time, or whose round wins do not equal the stored score. Read team_side to rebuild the CT table, and equipment_value to rebuild the bonus-round split.
Start free with a sandbox key: a fixed sample of past matches, no card.
Cite this
EsportsOdds, "CS2 pistol rounds: first-pistol winners win 59.5% of maps", 2 November 2026. https://esportsodds.gg/learn/cs2-pistol-rounds