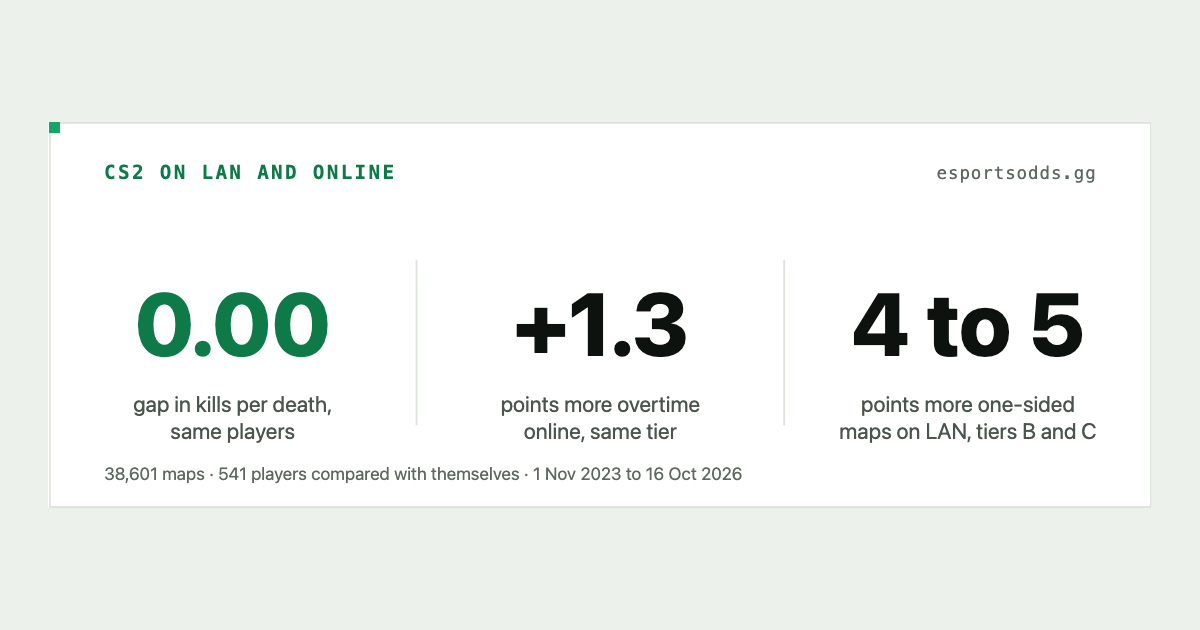
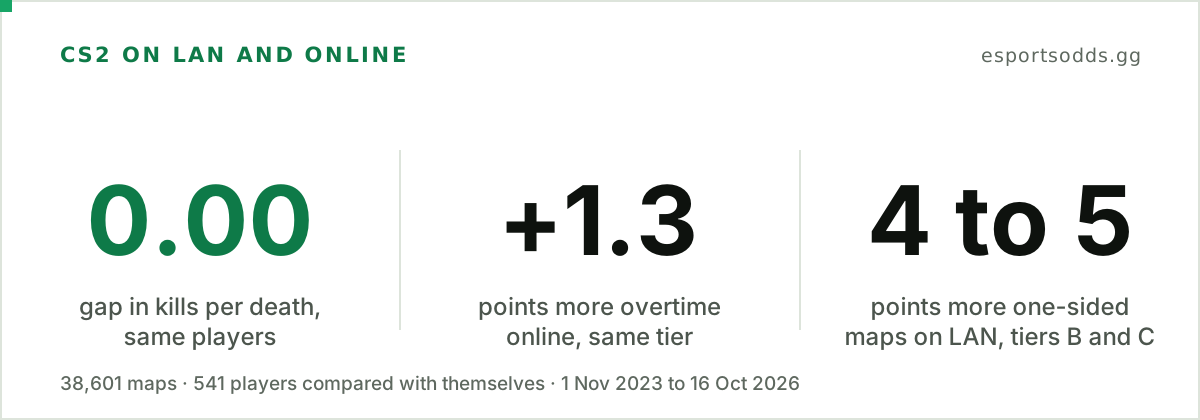
Bottom line: Pro CS2 players post almost the same numbers on LAN as online. Across 541 players with at least 20 maps in each setting at the same tier, kills per death is the same on LAN and online (1.024 against 1.025), ADR and KAST differ by less than half a point, and the only steady gap is a headshot share about 0.6 points higher online. The maps differ more than the players do: in the same tier, online maps went to overtime 1.3 points more often over the whole period (almost all of it in 2024 and 2025; in 2026 alone the gap is 0.5 points and could be nothing), and in tiers B and C LAN maps were one-sided 4 to 5 points more often. The map figures come from 38,601 maps and the player figures from about 144,000 player-map lines (November 2023 to October 2026) in our CS2 data API.
What we compared
Most tournaments in our data are labelled lan or online (about 96% of events, covering 99.5% of completed matches; matches at an unlabelled event are left out). The sample is every played map (a handful with scores that cannot happen under MR12 rules are dropped) from a completed CS2 match scheduled from 1 November 2023 to 16 October 2026 at an event with a label and a tier: 38,601 maps from 17,847 matches, 10,333 on LAN and 28,268 online. Tiers are the event tiers in our data, S for the top events down to C for the smallest.
The two settings are not spread evenly across tiers, and that matters more than anything else here:
| Tier | LAN maps | Online maps |
|---|---|---|
| S | 4,812 | 355 |
| A | 1,445 | 1,350 |
| B | 3,299 | 22,907 |
| C | 777 | 3,656 |
Tier S is 93% LAN and tier B is 87% online, so a raw LAN-against-online comparison mostly compares top events with small ones. Every comparison below is made inside a tier, and for maps also inside the same year and map, then combined. The bars show raw shares; the gaps in the text are the adjusted ones, so they differ from a subtraction of the bars by a few tenths. (About 0.6% of maps sit in a group that has only one setting and drop out of the gaps.)
Same players, same numbers
The cleanest test is to compare a player with themselves. We took every player with at least 20 maps in each setting inside the same tier (tiers S, A and B; tier C has too few): 682 player-tier pairs, 541 players, 44,442 LAN and 99,079 online player-map lines. For each pair we took the gap between the two settings and averaged it (the gaps come from unrounded means; headshot data is complete for 663 of the 682 pairs).
| Measure | On LAN | Online | Online minus LAN | 95% interval |
|---|---|---|---|---|
| Kills per death | 1.024 | 1.025 | +0.000 | -0.007 to +0.008 |
| ADR | 74.5 | 74.9 | +0.32 | -0.03 to +0.68 |
| KAST | 73.4% | 73.3% | -0.10 points | -0.31 to +0.12 |
| Headshot share of kills | 50.6% | 51.2% | +0.60 points | +0.31 to +0.88 |
- Kills per death is the same on average. The interval rules out an average gap larger than about 0.008. Individual players vary far more than that: about a quarter of the pairs differ by more than 0.10.
- ADR and KAST move by less than half a point. Both intervals include zero. Raising the bar to 40 maps in each setting leaves 257 pairs: the ADR gap changes sign (-0.17), and KAST comes out 0.3 points lower online (-0.6 to -0.05), still under half a point.
- The headshot share is the one gap that stays. Online players land about 0.6 points more of their kills as headshots. It points the same way in tiers S, A and B and at both cut-offs (+0.7 points at 40 maps), and it is small: about 1% of the figure itself. We do not know why.
- Tier S is the one place ADR and KAST are clearly higher online. For 67 players in tier S, ADR is 1.3 higher and KAST 0.9 points higher online. But the median player there has 24 online maps against 251 on LAN, and the opponents differ between the two, so we would not call it a LAN penalty. In tier B the KAST gap runs the other way (0.3 points lower online), so no direction holds across tiers.
Online maps go to overtime a bit more
Pooled across tiers, the two settings look the same: 11.7% of LAN maps and 12.0% of online maps went to overtime. That hides the gap, because LAN is concentrated in tier S, which has more overtime than tier B, where most online maps are. Inside each tier the picture is different:
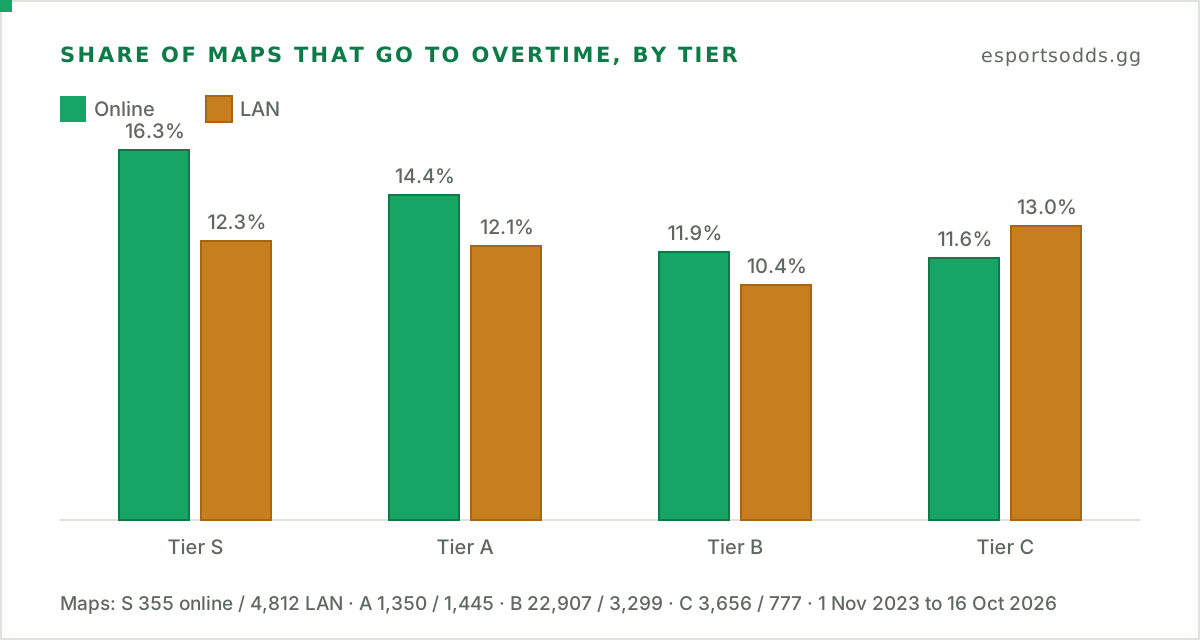
Online is higher in tiers S, A and B and lower in tier C. Combined across tiers, years and maps, online maps went to overtime 1.3 points more often (95% interval 0.3 to 2.2), about one extra overtime in 80 maps. Adding the best-of format to the comparison moves that to 1.4 points, and a permutation test that reshuffles the LAN and online labels across matches gives the same answer (p = 0.01). No single tier is decisive on its own: tier B, which has most of the data, shows 1.3 points (0.2 to 2.5), and the tier S figure of 16.3% rests on 355 online maps.
The gap is not steady over time. By calendar year it is +2.9 points in 2024 (0.5 to 5.2) and +2.2 in 2025 (0.3 to 4.2), but +0.6 in 2023 (-4.2 to 5.2, on 1,261 maps) and +0.5 in 2026 so far (-0.8 to 1.7). The 2026 figure is the largest sample and cannot be told from zero, so read the 1.3 as an average over the period, not as a standing effect. For the overall rate and what overtime is, see how often CS2 maps go to overtime.
LAN maps are more one-sided in the lower tiers
A map is one-sided here when the winner has 13 and the loser 5 or fewer rounds.
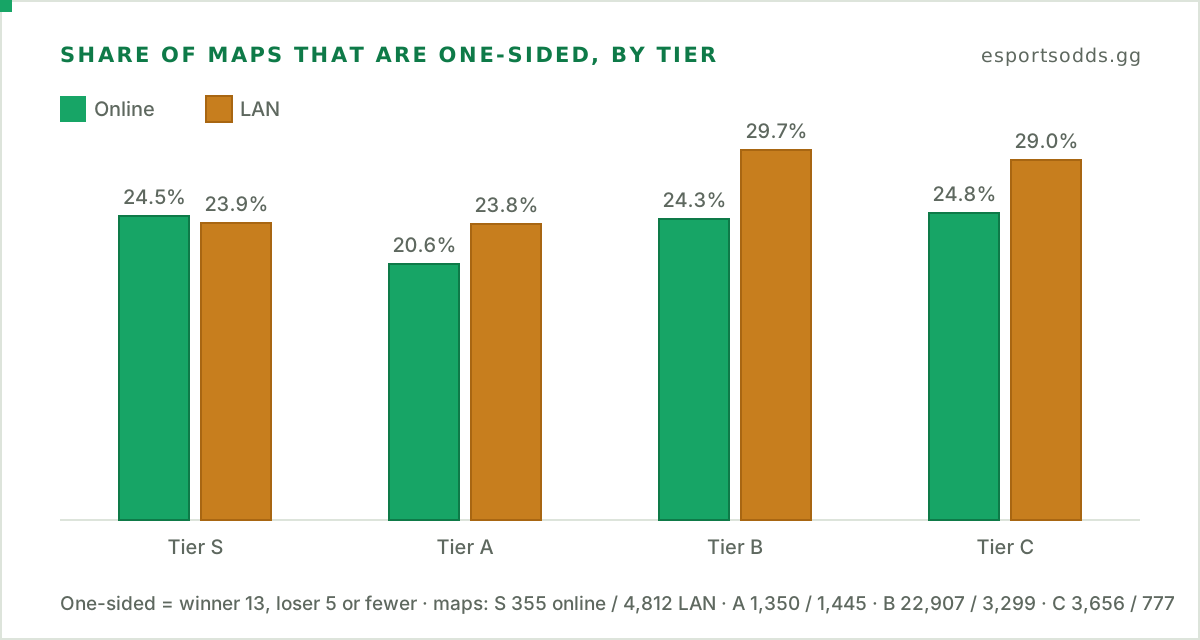
In tiers B and C, LAN maps were one-sided 5.1 and 4.3 points more often than online maps (intervals 3.4 to 6.8 and 0.7 to 8.1). In tier A the gap is 3.3 points and its interval just reaches zero (0.0 to 6.5). Tier S shows no clear gap (24.5% online, 23.9% on LAN), but with only 355 online maps its interval runs about 5 points either way. Best-of-threes point the same way, more weakly: after adjusting for tier and year, online series played a third map 2.5 points more often (about 0.1 to 5.0), against raw rates that look equal (39.2% on LAN, 39.4% online). That result moves with how forfeited third maps are counted, so we would not lean on it.
What this does not tell you
The same players post the same numbers, yet over the period the maps were a little closer online. That pattern fits who plays whom better than how well they play. One candidate is the draw: online cups and league playoffs may pair closer teams, while a LAN bracket in a lower tier can put a strong team against a weak one. We have not tested that. The map comparison has no team-strength measure and does not separate group stages from playoffs, and the player comparison only covers players who appeared in both settings, who are the regulars. Treat the overtime and one-sided gaps as measured, and the reason as a hypothesis.
Compute it yourself
A match row carries its tournament's id and tier, and the tournaments route carries each event's setting, so the split is two loops with the Python client (pip install esportsodds):
from collections import Counter

from esportsodds import Client

client = Client()  # reads ESPORTSODDS_API_KEY from the environment

# Which events are LAN and which are online (500 tournaments per request)
setting = {}
for year in (2025, 2026):
    for t in client.tournaments.iter(year=year):
        if t["event_type"]:
            setting[t["id"]] = t["event_type"]

# Completed matches with their maps, 25 per request
maps, overtime = Counter(), Counter()
for match in client.matches.iter_bulk(
    include="maps", status="completed", date_from="2026-01-01", limit=25, max_pages=40
):
    key = (match["tournament_tier"], setting.get(match["tournament_id"]))
    if None in key:
        continue
    for m in match["maps"]:
        if m["status"] != "played":
            continue
        maps[key] += 1
        if max(m["score_a"], m["score_b"]) >= 16:  # MR12: a regulation map ends on 13
            overtime[key] += 1

for key in sorted(maps):
    print(key, maps[key], f"{overtime[key] / maps[key]:.1%}")
That reads the 1,000 most recent completed matches since 1 January 2026 (the list runs newest first) and prints the overtime share for each tier and setting; raise max_pages for more, and expect few tier S online maps. It needs a paid key: the free sandbox key is refused on both the bulk and tournaments routes. Compare inside a tier: the pooled LAN and online rates are close to equal and say nothing. Events that started before 2025 are skipped, and start no earlier than November 2023 if you go further back: before that the data is partly CS played as MR15. The per-player lines (kills, deaths, ADR, KAST and headshots, per map) come from GET /v1/cs2/matches/{id}/stats; the player stats guide covers the rest of the player routes.
Questions
Do CS2 players play better on LAN or online?
Neither, on the numbers we have. The same players post the same kills per death in both settings (1.024 on LAN, 1.025 online), and ADR and KAST differ by less than half a point. Headshot share is about 0.6 points higher online.
Do more CS2 maps go to overtime online?
Slightly, on average. Inside the same tier, online maps went to overtime 1.3 points more often than LAN maps between November 2023 and October 2026, about one extra in 80 (95% interval 0.3 to 2.2). The gap sits in 2024 and 2025; in 2026 alone it is 0.5 points (-0.8 to 1.7). Pooled across tiers the rates look equal, because of the tier mix.
Where do these numbers come from?
From the map results and player stats in the EsportsOdds CS2 data API, as of 17 October 2026. They describe past maps and say nothing about the next one.
Cite this
EsportsOdds, "Do CS2 players play differently on LAN? 38,601 pro maps", 17 October 2026. https://esportsodds.gg/learn/cs2-lan-vs-online