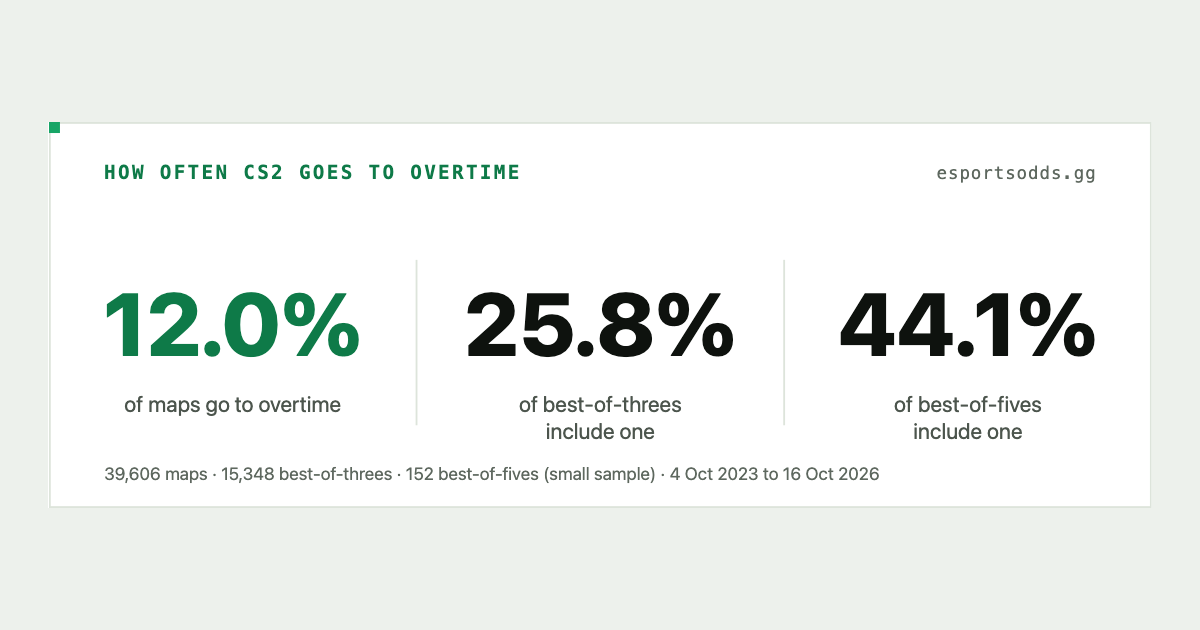
Bottom line: Of 39,606 played professional CS2 maps since October 2023, 12.0% went to overtime, about one map in eight. Because a best-of-three has two or three maps, 25.8% of best-of-threes include at least one. No map is clearly more overtime-prone than another (among the nine maps with 1,000 or more played, the range is 11.5% to 12.6%), and 70% of overtimes end in the first one. The map scores behind every figure are in the CS2 data API.
What counts as overtime
A competitive CS2 map is played as MR12: 12 rounds a half, and the first team to 13 wins. A regulation map therefore ends 13-0 to 13-11. At 12-12 the map goes to overtime, played in six-round blocks (three rounds a side), and the first side to win four of the six takes the map. If the block ends 3-3, another one starts.
That rule fixes the final score. The winner of a one-overtime map finishes on 16, of a two-overtime map on 19, of a three-overtime map on 22, and so on. So a map is an overtime map when its winner reached 16 or more, and the scores in our data follow the rule closely: of 4,742 such maps, 4,730 have a score the overtime sequence can produce (16-12, 16-13 and 16-14 for one overtime; 19-15, 19-16 and 19-17 for two). The other 12 are odd shapes, such as 16-15 or 20-19. They stay in the count and change nothing.
How the 39,606 maps were chosen:
- Played maps only, from completed matches that our data labels as CS2 (4 October 2023 to 16 October 2026). Walkovers, technical results and maps with no status are not counted.
- 15 maps look like the older 30-round format (a winner on 13 to 15 after 25 or more rounds) and are left out. The rate is 11.97% with them and 11.97% without, so this changes nothing visible.
- Overtime is counted from the score, not from the
overtime_aandovertime_bfields. Those fields are filled from the round-level layer and stay empty on maps without it, even after an overtime, so counting by them finds 4,443 overtime maps and counting by score finds 4,742.
The headline: one map in eight
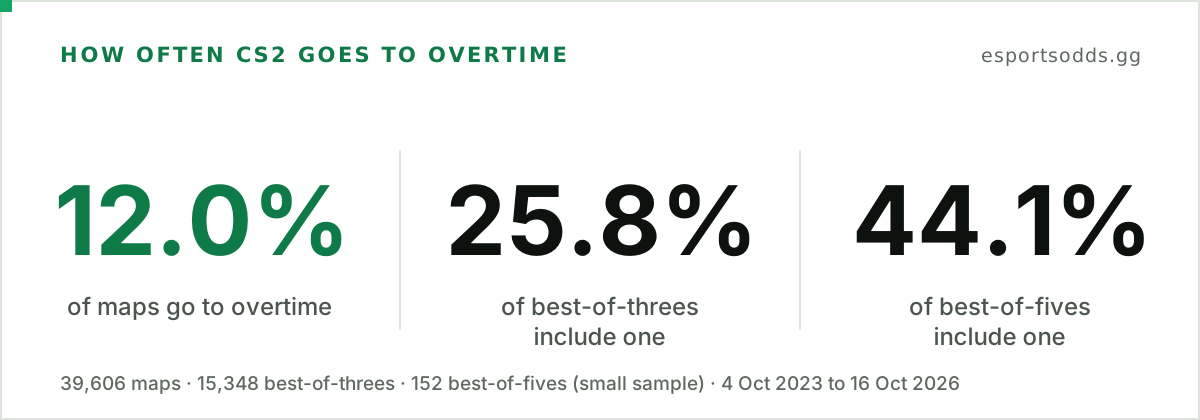
The map-level rate is 11.97%, and with this many maps the 95% margin of error is about 0.3 points. The series rates follow from it. A best-of-one has one chance at overtime and reaches it 10.9% of the time (2,788 series). A best-of-three has two or three chances and reaches it 25.8% of the time (3,959 of 15,348). A best-of-five, with three to five maps, is at 44.1%, but that is only 152 series and its margin is about 8 points, so read it as "roughly four in ten".
Map number makes little difference. In best-of-threes, map 1 went to overtime 11.9% of the time (15,050 maps), map 2 12.0% (15,043) and the decider 12.3% (6,127). Each of those figures has a margin of about 0.5 to 0.8 points, so the three sit within a few tenths of each other: a hint at most.
Does the map matter?
Barely. The nine maps with at least 1,000 played maps sit in a band about one point wide.
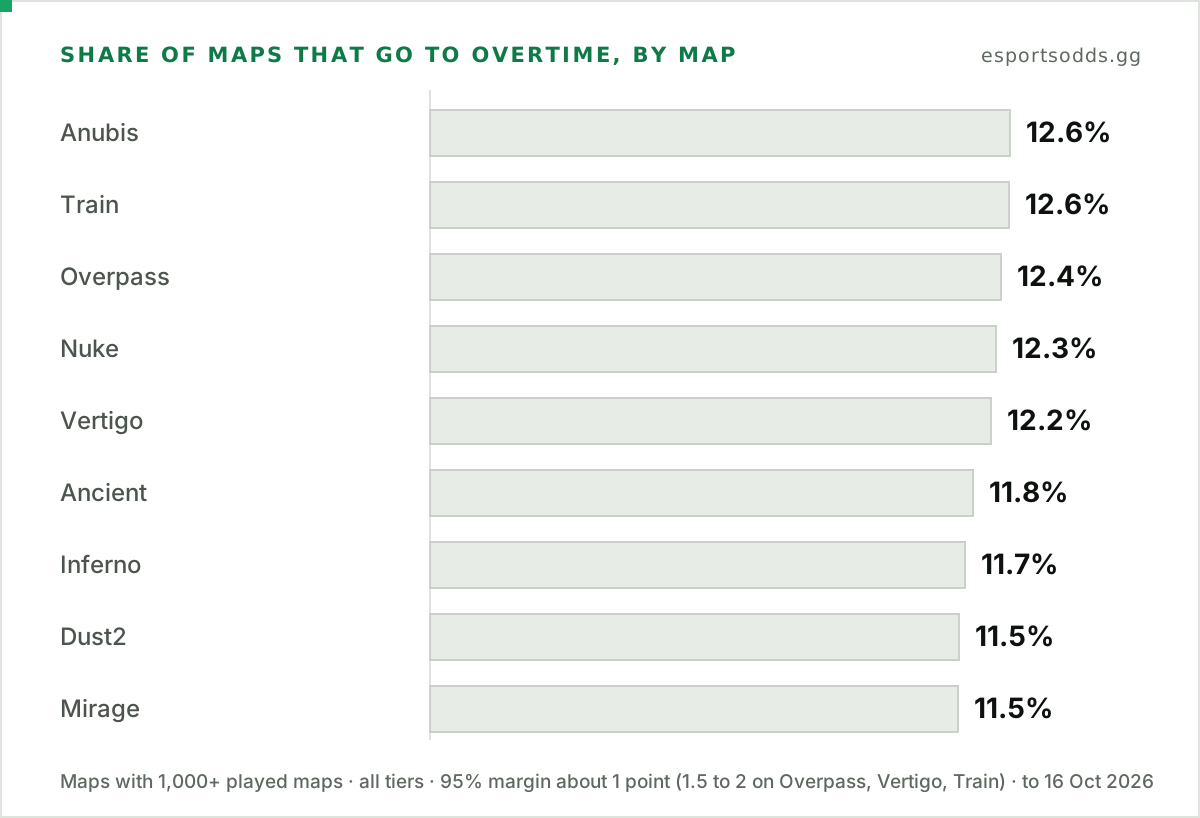
Anubis and Train sit at the top, Mirage and Dust2 at the bottom, and the gap between the ends is 1.1 points. The margin on each figure is about one point for the six big maps, 1.5 for Overpass and 2 for Train and Vertigo, so every map's range overlaps every other map's. A test across all nine maps finds nothing we could tell apart from chance (p = 0.61), and even the widest pair, Anubis against Mirage, falls short of the usual bar (p = 0.08). The name of the map tells you little. Cache, with 975 maps, is under the 1,000-map line and left out of the chart (13.4%, a margin of about 2 points).
The half score is a closer guide than the map. In our comebacks study (data to July 2026), a level 6-6 half reached overtime about twice as often as a 3-9 half, 16.8% against 8.2%: close halves produce overtime, lopsided ones rarely do.
Does the tier matter?
A little. Tiers here are the event tiers in our data, S for the top events down to C for the smallest.
| Tier | Maps | Went to overtime |
|---|---|---|
| S | 5,337 | 12.6% |
| A | 2,795 | 13.2% |
| B | 26,948 | 11.8% |
| C | 4,433 | 11.8% |
S and A together run about a point above B and C (12.8% against 11.8%), a gap a little larger than chance alone would usually produce (p = 0.01). Taken one tier at a time the picture is less clear: S sits below A, and the four tiers together do not clear the usual bar (p = 0.07). We have not tested why the top tiers might run slightly higher, so we would not build much on it. (93 maps from unranked tournaments are left out of the table.) Whether the event was played on LAN or online is another cut: see LAN vs online in CS2 for how overtime and one-sided maps differ between the two inside a tier.
How long does an overtime last?
Mostly one block. Counting the 4,730 overtime maps whose score fits the sequence:
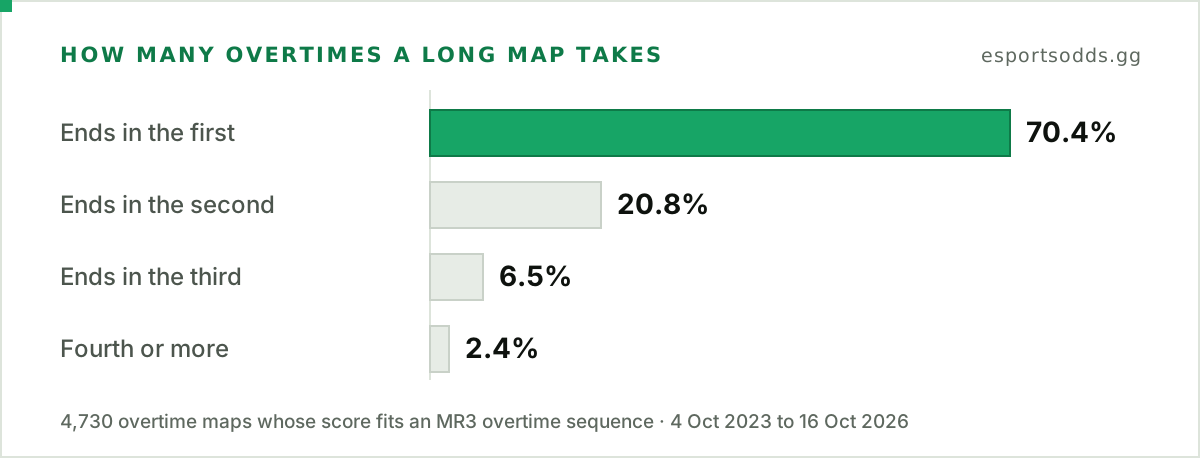
The shape is close to what a coin flip would give. Two evenly matched sides tie a six-round block 3-3 about 31% of the time (20 of the 64 equally likely outcomes). In the data, 29.6% of first overtimes need a second, 30.0% of second overtimes need a third, and 27.1% of third overtimes need a fourth. That is a little under 31%, which fits teams that are close but not identical: each extra block behaves like a near toss-up, tilted slightly toward whoever is stronger.
Has it changed?
| Year | Maps | Went to overtime |
|---|---|---|
| 2023 (from 4 October) | 2,173 | 13.4% |
| 2024 | 10,088 | 12.2% |
| 2025 | 11,194 | 12.0% |
| 2026 (to 16 October) | 16,151 | 11.7% |
The 2023 row covers only three months, and its margin is about 1.4 points. From 2024 on the rate is flat within each year's margin of error, and the drop from the first CS2 months is only just larger than that margin. The mix of events, the map pool and the share of lower-tier matches all changed over the same period, and any of them can shift an average. We have not separated them, so we would not call this a trend.
Compute it yourself
The map scores are in every match record. With the Python client (pip install esportsodds), one bulk request returns 25 matches with their maps:
from esportsodds import Client

client = Client()  # reads ESPORTSODDS_API_KEY from the environment

maps = overtime = 0
for match in client.matches.iter_bulk(
    include="maps", status="completed", date_from="2026-01-01", limit=25, max_pages=10
):
    for m in match["maps"]:
        if m["status"] != "played":
            continue
        maps += 1
        if max(m["score_a"], m["score_b"]) >= 16:  # MR12: a regulation map ends on 13
            overtime += 1

print(f"{overtime} of {maps} maps went to overtime ({overtime / maps:.1%})")
That reads the newest 250 completed matches since 1 January 2026, ten requests in all; raise max_pages for more, and group by m["map_name"] or by the match row's tournament_tier for the cuts above. Start no earlier than November 2023: before that the data is partly CS, much of it played as MR15 (30 rounds), where a score of 16 is a normal win. The API does not expose our CS2 label, so a rebuild from November 2023 will land within a few maps of the figures here, not exactly on them. Each map row also carries rounds_played, the halves and, where the round layer exists, the overtime rounds.
A free sandbox key cannot call the bulk route, but it can read the same map rows one match at a time, from /v1/cs2/matches/{id}/maps, on its sample of past matches.
Questions
What percentage of CS2 maps go to overtime?
About 12%. Across 39,606 played professional maps from October 2023 to October 2026, 4,742 (11.97%) went to overtime.
Which CS2 map goes to overtime most often?
Anubis and Train are highest at 12.6%, and Mirage and Dust2 lowest at 11.5%. The spread is about one point, and a test across the nine maps with 1,000 or more played finds nothing beyond chance.
How many rounds is a CS2 overtime?
Six rounds, three on each side. The first team to win four takes the map; if it ends 3-3, another six-round block follows.
Where do these numbers come from?
From the map results in the EsportsOdds CS2 data API, as of 17 October 2026. They describe past maps and say nothing about the next one.
Cite this
EsportsOdds, "How often do CS2 maps go to overtime? 39,606 pro maps", 17 October 2026. https://esportsodds.gg/learn/cs2-overtime-rate