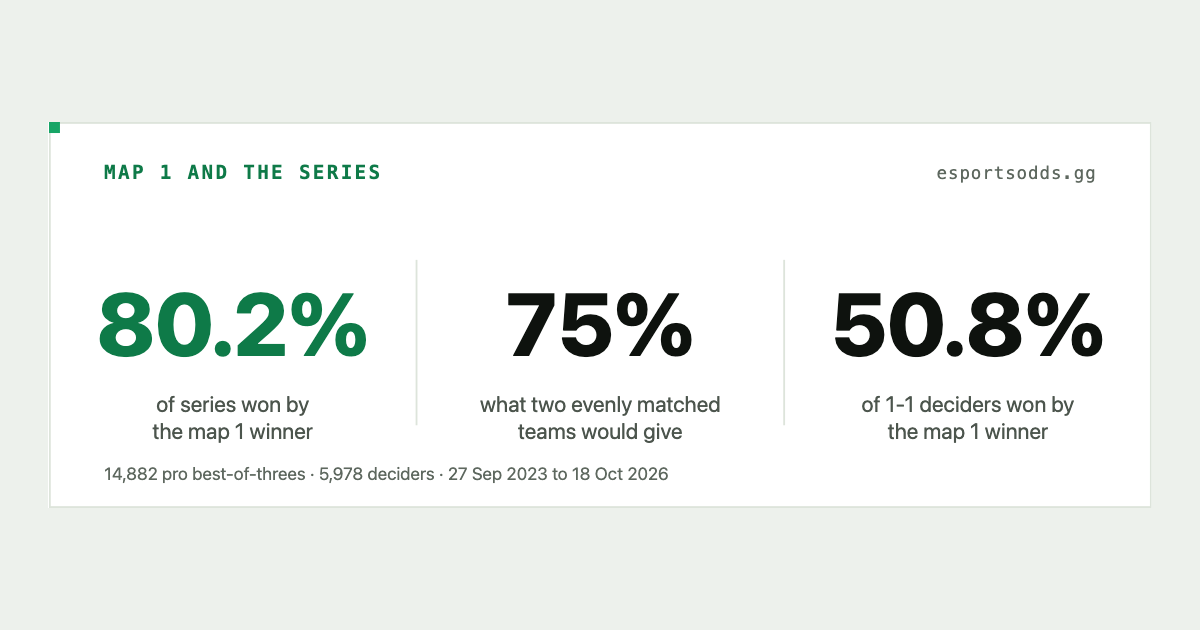
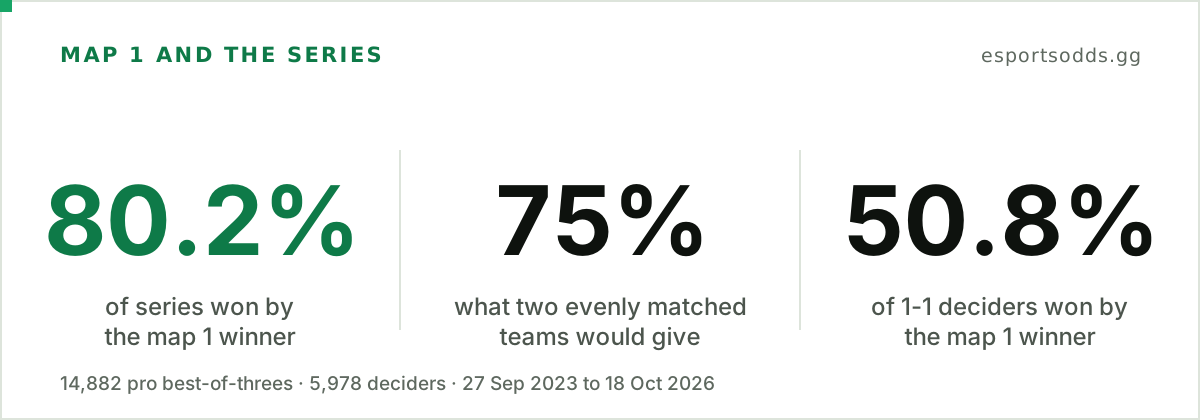
Bottom line: In a professional CS2 best-of-three, the team that wins map 1 goes on to win the series 80.2% of the time (14,882 series since the CS2 launch, 95% margin 79.6% to 80.9%). That is five points above the 75% two evenly matched teams would produce, and the data points to team strength rather than carry-over: in the 5,978 series that reached a 1-1 decider, the map 1 winner won it 50.8% of the time, close to a coin flip. The match and map results behind every figure are in the CS2 data API.
What we counted
The unit is one completed series. From the CS2 launch on 27 September 2023 to 18 October 2026 our data holds 16,144 completed best-of-threes and best-of-fives. We kept the 15,020 where every map was played out to a normal result and the stored maps add up to the series score: 14,882 best-of-threes and 138 best-of-fives.
The rest were set aside, not guessed at. 253 series have no map rows at all. Another 552 had a map that was not played out (a forfeit, an abandon or a walkover), 217 had stored maps that disagree with the series score (mostly a missing map row), and 102 failed smaller checks such as a map recorded after the series was already decided. Together the exclusions are 7% of completed series. We have not shown that the set-aside series are unrelated to who won map 1, so every figure below describes the series that were played out and recorded in full.
The map 1 winner usually wins
| Best-of-three outcome | Series | Share |
|---|---|---|
| Map 1 winner wins 2-0 | 8,904 | 59.8% |
| Map 1 winner wins 2-1 after dropping map 2 | 3,036 | 20.4% |
| Map 1 loser wins the series 2-1 | 2,942 | 19.8% |
| Map 1 winner wins the series | 11,940 | 80.2% |
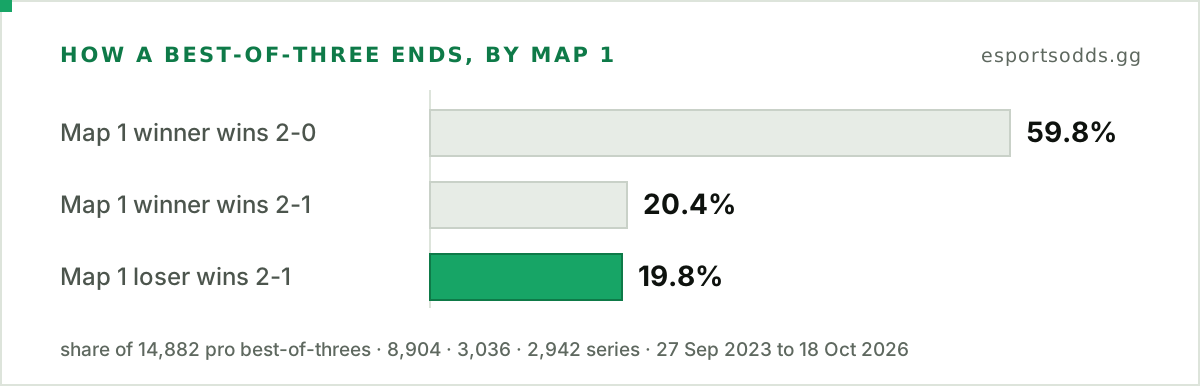
Four series in ten (40.2%) go to a decider, and in about one of those two the team that lost map 1 comes back to win it. So roughly one series in five is a comeback from a map 1 loss.
The comebacks study reported 79.5% for the same question across 16,481 series. That count covered every era, CS included, and every series whose first map had a decisive score, forfeits too. On CS2-era series alone the same query gives 79.7%, and 79.9% once a forfeited or abandoned first map is set aside (a team handed map 1 that way wins the series only 60.3% of the time, across 204 series). Requiring every map of the series to have been played out gives the 80.2% used here.
The coin-flip line
Take two evenly matched teams where every map is a 50-50 contest. The map 1 winner wins the series if they win map 2 (50%) or lose it and win the decider (25%): 75%. Real series come out higher, at 80.2%, because teams are not evenly matched. Where one side is better, it wins map 1 more often and keeps winning, so a map 1 result is some evidence of which team is stronger.
The same arithmetic applies to the sweeps. Two evenly matched teams would finish 2-0 half the time. The observed 59.8% points to real gaps in strength.
Is there momentum? The decider says little
The comebacks study left open whether the lead over the coin-flip line is one team being better or carrying momentum. The tempting reading is that winning map 1 hands a team confidence for the rest of the series. A 1-1 decider is where that would show, and it has a useful property. If each map were an independent contest between the same two teams, the map 1 winner would win a 1-1 decider half the time however lopsided the matchup, because both teams have won exactly one map and the order says nothing about who is stronger.
| 1-1 deciders | Won by the map 1 winner | 95% margin |
|---|---|---|
| 5,978 | 50.8% (3,036) | 49.5% to 52.1% |
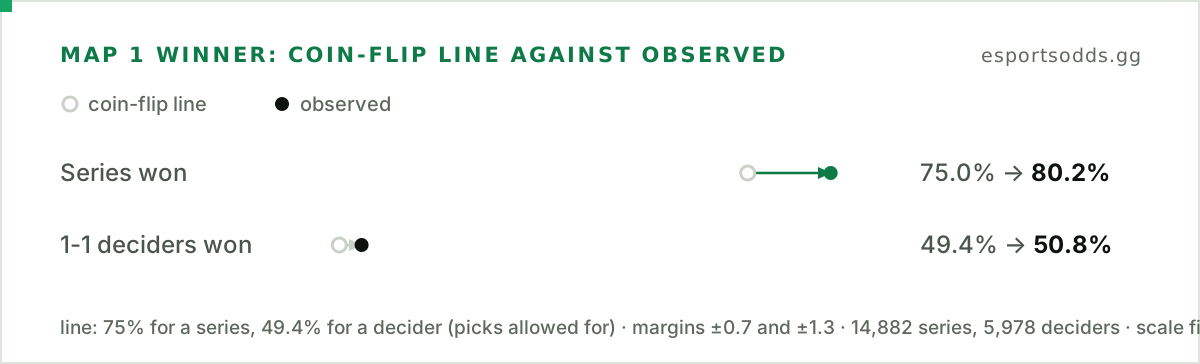
That is close to a coin flip. If carrying a map 1 win into a decider were worth much, this would sit well above 50%, and the margin keeps any net carry-over under about three points. The 80% is mostly the stronger team winning map 1 and then winning another map, not map 1 itself changing what happens next.
This is an approximate test, not a proof, for two reasons. First, picks and bans make teams unequal on each map, which pulls the no-carry-over line a little below 50%. In the pick study the picking team wins about four points more often, and the team that picks first, whose pick is played as map 1, is usually the weaker side (it wins 44.3% of series). A simple model built from those two figures puts the no-carry-over decider at about 49.4%, so the observed 50.8% sits 1.4 points above it, with a margin from 0.1 to 2.7 points. Second, the test measures net carry-over: the map 1 winner has also just lost map 2, so a lasting effect of winning map 1 and an effect of losing the latest map could offset each other.
By tier and by year
| Event tier | Series | Map 1 winner wins the series | 95% margin |
|---|---|---|---|
| S | 1,979 | 79.9% | 78.1% to 81.6% |
| A | 943 | 78.5% | 75.7% to 81.0% |
| B | 10,123 | 80.6% | 79.8% to 81.3% |
| C | 1,656 | 78.8% | 76.8% to 80.7% |
| No tier | 181 | 87.3% | 81.7% to 91.4% |
Tiers S to C span about two points and their margins overlap. Events with no tier are higher at 87.3%, but that is only 181 series. By year the rate is just as steady: 79.0% in 2023 (from 27 September, 943 series), 79.2% in 2024 (3,436), 80.7% in 2025 (4,139) and 80.6% in 2026 so far (6,364). The two splits are not independent: all 1,656 tier C series and all 181 no-tier series are from 2026, so a tier effect and a year effect cannot be told apart for them. Resampling whole calendar months, which allows for a stretch of time that runs hot or cold, gives 79.5% to 80.9% for the best-of-three headline.
Best-of-fives
For best-of-fives the coin-flip line is 68.75%: the map 1 winner needs two more wins before the other side gets three. The observed rate is 76.1% (105 of 138 series, margin 68.3% to 82.4%). That is above the line, but the margin reaches down to it, and 138 series is too few to say more than that it points the same way as the best-of-threes.
What this does not tell you
It describes past series and says nothing about the next one. The 80.2% is an average over mixed matchups, not a number for a particular pairing. The margins treat each series as independent, although the same teams appear many times, so they are a little optimistic.
Compute it yourself
Map results are on the match records where we hold them. With the Python client (pip install esportsodds), the bulk route returns 25 matches a page with their maps:
from datetime import date, timedelta

from esportsodds import Client

client = Client()  # reads ESPORTSODDS_API_KEY from the environment
since = (date.today() - timedelta(days=7)).isoformat()  # a week is about a dozen bulk pages


def winner(m):
    """'a' or 'b', or None if the map was not played out (a null status counts as played)."""
    played = m["status"] in (None, "played") and max(m["score_a"], m["score_b"]) >= 13
    if not played or m["score_a"] == m["score_b"]:
        return None
    return "a" if m["score_a"] > m["score_b"] else "b"


series = map_one_won = 0
for match in client.matches.iter_bulk(
    include="maps", has="maps", status="completed", date_from=since, limit=25
):
    if match["format"] != "bo3" or match["result_type"] == "walkover":
        continue
    won = [winner(m) for m in sorted(match["maps"], key=lambda m: m["map_number"])]
    if None in won or (won.count("a"), won.count("b")) != (match["score_a"], match["score_b"]):
        continue  # a map is missing or was not played out, or the maps do not add up to the series score
    series += 1
    map_one_won += won[0] == ("a" if match["score_a"] > match["score_b"] else "b")

print(f"Map 1 winner took the series in {map_one_won} of {series} best-of-threes ({map_one_won / series:.1%})")
The status rule follows the API reference: a null map status means the source did not say, and should be read as played. A week is a few hundred series, so expect a rate within a few points of 80% rather than the table's figure. Each page counts as one bulk-export request, and the 14-day money-back guarantee on a first subscription holds only while an account has made fewer than 1,000 requests and no more than 20 bulk-export requests since its first payment, so the week above stays inside it. Setting since = "2023-09-27" reads the whole history, 18,984 matches or 760 pages, and gives about 80%, a shade different from the table because the table also drops a few series that break smaller consistency checks; run that only once you no longer need the guarantee. The same match records also carry halftime scores, so the comeback study can be rebuilt the same way, and the map win rates show how much the map itself moves a result. The pick study uses the same records to ask whether the map a team picks wins more often.
Frequently asked questions
Does winning map 1 win a CS2 best-of-three?
Usually. Across 14,882 professional best-of-threes since the CS2 launch, the map 1 winner won the series 80.2% of the time, with 59.8% of series ending 2-0.
How often does a team win after losing map 1?
19.8% of best-of-threes, or about one in five. That is the comeback rate: the team lost map 1 and still took the series 2-1.
Does winning map 1 give a team momentum?
Not much, on this data. In 1-1 series the map 1 winner won the decider 50.8% of the time (5,978 series, margin 49.5% to 52.1%), close to the 50% that independent maps would give, so any net carry-over is under about three points.
Where do these numbers come from?
From the match and map results in the EsportsOdds CS2 data API, as of 18 October 2026. They describe past series and say nothing about the next one.
Cite this
EsportsOdds, "Does winning map 1 win the series in CS2? 14,882 pro best-of-threes", 18 October 2026. https://esportsodds.gg/learn/cs2-map-1-winner-series