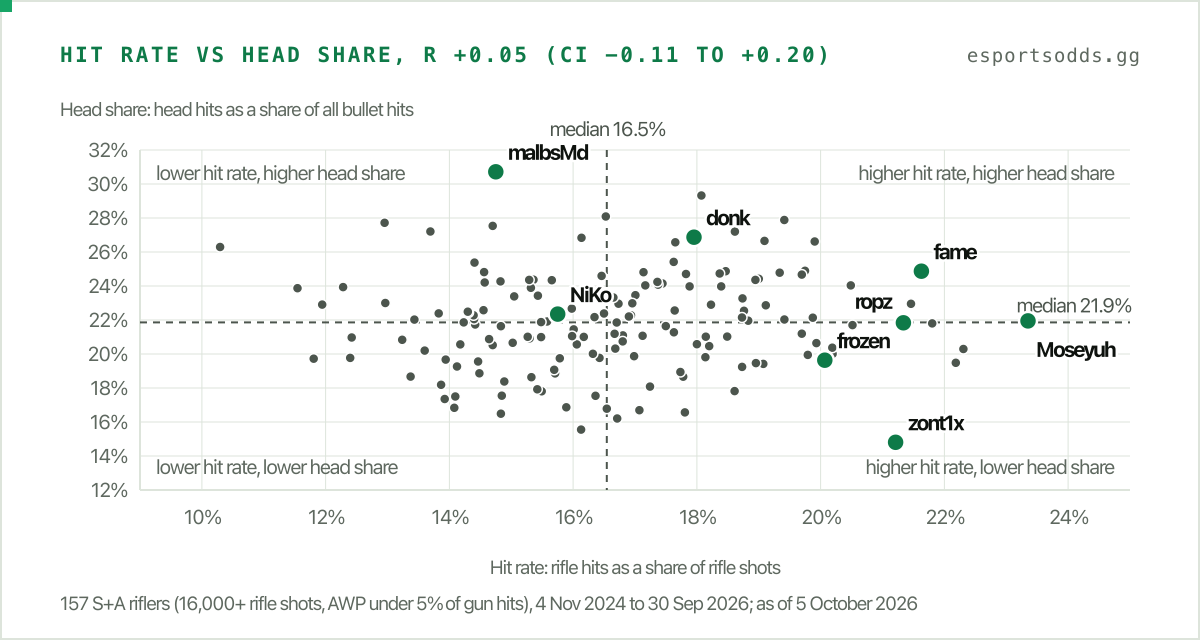
Bottom line: Across 157 S and A tier pro riflers, the share of rifle shots that hit and the share of hits that land on the head show no detectable link (r = +0.05, 95% CI −0.11 to +0.20; 660 B and C tier riflers in separate matches give −0.02), although each trait is stable from year to year. Of 11.0 million recorded hits, 22.0% landed on the head, yet 52.2% of killing blows were headshots, and the AK-47's head hit was the killing blow 90.0% of the time against 67.0% for the M4A1-S, a gap that is partly the gun and partly the side it is played on. The recorded right-to-left arm ratio fell from 4.90 to 2.95 across a Valve update in October 2024 (three weeks before against three weeks after) while the share of hits on the arms stayed at 10.9%. Every figure is computed from the same match data behind the EsportsOdds CS2 data API as of 5 October 2026.
Two kinds of aim
Two numbers describe how a rifler's bullets behave. Hit rate, often called accuracy, is the share of rifle shots recorded as hits (the AK-47, M4A1-S, M4A4, Galil AR and FAMAS; the AUG and SG 553, under 0.2% of rifle-class shots, are left out). Head share is the share of all bullet hits, from any gun, that land on the head. If aim were a single skill, the best shooters would sit on a diagonal: hit more, and hit the head more. Here are 157 S and A tier riflers on both axes:
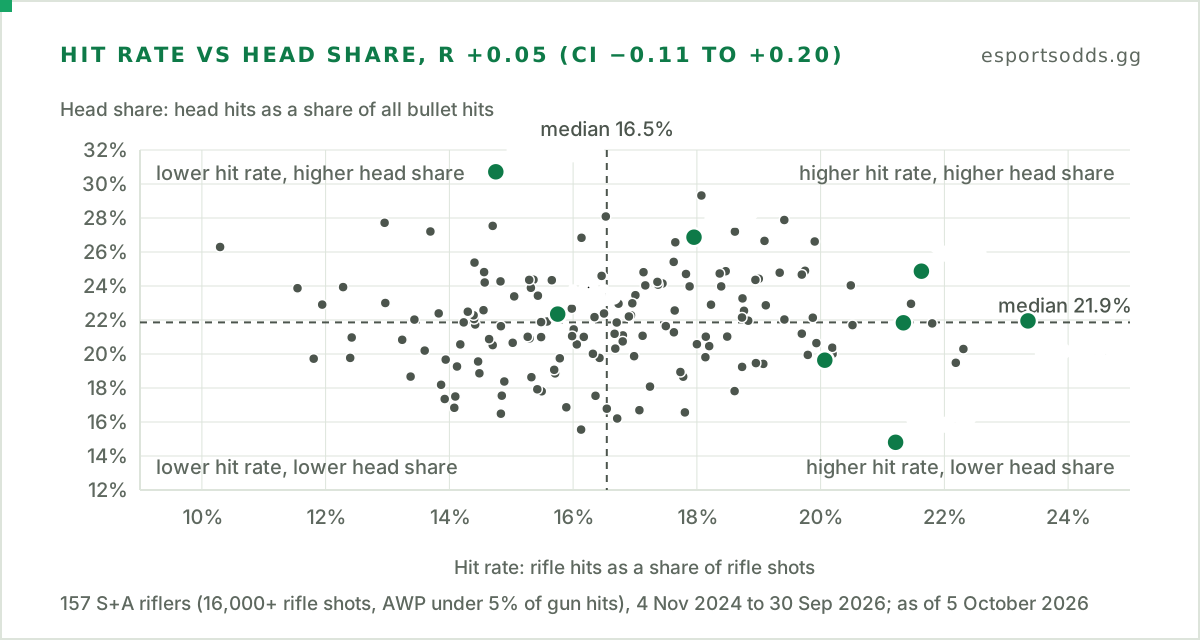
It is a cloud with, at most, a faint lean along the diagonal. The correlation is +0.05 (95% CI −0.11 to +0.20) and every quadrant has players in it. Counting only players whose 90% intervals clear both medians (16.5% hit rate, 21.9% head share), 29 are high on both, 30 are low on both, 19 hit often but rarely to the head, and 19 do the reverse. That is 59 on the diagonal to 38 off it, the one count here that tilts toward a link (a sign test gives p = 0.042), but it rests on a subset chosen by where players fall against two medians, so we read it as weak evidence at most. The other 60 sit near the middle on at least one axis.
The poles are easy to name. zont1x lands 21.2% of rifle shots, eighth best of the 157, yet only 14.8% of hits go to the head, against a median of 21.9%. malbsMd is the mirror image: a below-median hit rate and a head share of 30.7%, the highest of the 157. donk is high on both (18.0% and 26.9%), while ropz is seventh in hit rate (21.3%) with a head share (21.8%) right on the median.
Is this an accident of how we cut it? We ran the correlation eleven ways. None of the cuts was pre-registered: the main cut came first, the others were added as checks on it, and the rank correlation came last. Every one is shown.
| Cut | Players | Correlation | 95% interval |
|---|---|---|---|
| Main: 16,000+ rifle shots, S and A tier | 157 | +0.05 | −0.11 to +0.20 |
| 12,000+ rifle shots | 189 | +0.05 | −0.09 to +0.19 |
| 24,000+ rifle shots | 121 | +0.02 | −0.16 to +0.20 |
| S-tier events only (10,000+ shots) | 152 | +0.07 | −0.09 to +0.23 |
| First year only (4 Nov 2024 to 31 Oct 2025, 8,000+ shots) | 150 | +0.01 | −0.15 to +0.17 |
| Second year only (1 Nov 2025 to 30 Sep 2026, 8,000+ shots) | 154 | +0.11 | −0.04 to +0.27 |
| Hit rate adjusted for which rifles were used | 157 | +0.05 | −0.10 to +0.21 |
| Head share from rifle-dominant rows (300+ hits) | 133 | −0.01 | −0.18 to +0.16 |
| Hit rate vs rifle headshot % of kills | 157 | 0.00 | −0.15 to +0.16 |
| Rank correlation (Spearman), main set | 157 | +0.10 | −0.05 to +0.26 |
| Replication: B and C tier events, 16,000+ shots | 660 | −0.02 | −0.09 to +0.06 |
Rifle-dominant rows are player-sides in which the five rifles made up at least 90% of the player's gun hits (with at least 15 gun hits); that cut keeps the players with 300 or more bullet hits in such rows. The adjusted hit rate subtracts what the league's rate with each rifle predicts for the player's mix of shots, with those rates taken from all S and A tier players in the window.
No interval excludes zero, and none lies wholly beyond ±0.15. That does not prove there is no link: the main interval reaches +0.20, so a small positive link cannot be ruled out. What the data do rule out is a strong one, since no cut's interval reaches +0.3. The tightest cut is the replication on 660 B and C tier players in a separate set of matches (87 of them also appear in the main set, in different matches): r = −0.02 (−0.09 to +0.06), and −0.02 (−0.10 to +0.06) without those 87. Noise in the measurements is not hiding a link either. Split each player's matches into random halves, 1,000 times over, and on average the two halves' hit rates correlate at 0.95 and their head shares at 0.93 (0.97 and 0.96 once corrected to the full sample); correcting the headline correlation for that noise leaves r = +0.05.
What hit rate is, and what it is not
Each trait is stable from year to year. Take the 133 players who fired at least 5,000 rifle shots in each of the window's two years and used the AWP for under 5% of their gun hits (125 of them are among the 157 above). Their year-one and year-two hit rates correlate at 0.83 (95% CI 0.77 to 0.87) and their head shares at 0.88 (0.84 to 0.91). Across these players the average hit rate barely moved (16.7% to 16.8%) and the average head share went from 21.6% to 22.0%. The 41 players whose main team changed between the years stayed strongly correlated, at 0.70 (0.50 to 0.83) and 0.81 (0.66 to 0.89), though lower than the 92 who stayed put (0.88 and 0.91): clearly lower for the hit rate, borderline for head share. So both traits follow a player from roster to roster, and for the hit rate part of the consistency comes with the team.
It is not damage. Across the 157, hit rate has no detectable relationship with ADR (r = 0.00, −0.15 to +0.16) and at most a modest one with K/D (+0.15, 0.00 to +0.30) and KAST (+0.18, +0.03 to +0.33). Every miss counts, including shots into smoke, at a sound or on a prefire, so hit rate says how a player's shots land, not how much damage they deal, and only a little about how many fights they win. Head share is similar, at +0.21 with K/D (+0.06 to +0.36) and +0.12 with ADR (−0.03 to +0.28). (ADR, damage per round, is explained in our ADR guide.)
Head share is the number you already know. It correlates +0.95 (+0.94 to +0.97) with the headshot percentage of kills on the scoreboard, so it is the same trait measured on hits instead of kills (the two overlap by construction, since every headshot kill needs a head hit). The scoreboard figure has no detectable relationship with hit rate either (r = +0.03, −0.12 to +0.19), which is the same finding seen from the other side.
The most accurate riflers, and the most head-heavy
Hit rate. Moseyuh leads at 23.4% (5,568 hits from 23,844 shots), ahead of ryu (22.3%) and BELCHONOKK (22.2%). ropz is seventh and zont1x eighth. The median rifler hits 16.5% of rifle shots.
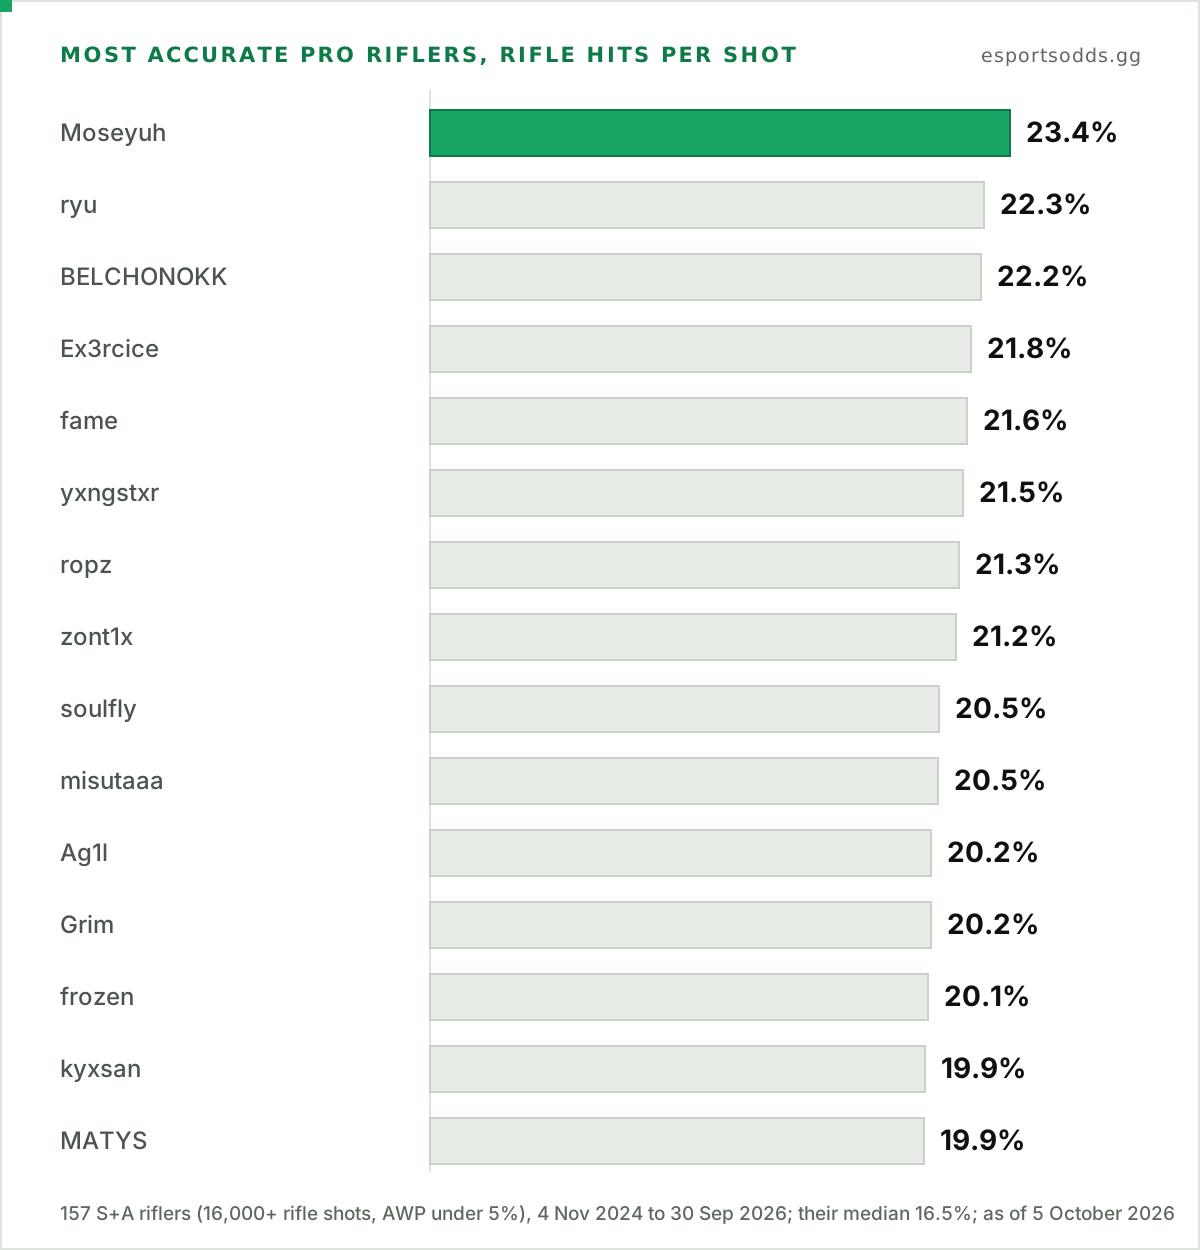
Each player's 90% interval runs about 0.6 points either side of their hit rate (at most 1.1), so the top of the list is not cleanly ordered. Compared directly, Moseyuh's lead over ryu (about one point) is within the noise (95% interval −0.4 to +2.5 points), while his 1.2-point lead over BELCHONOKK only just clears it (+0.1 to +2.3). Gun choice does not explain the order. The M4s and FAMAS hit more often than the AK-47 across the league, so we also compared each player with the league's rate for the same mix of rifles. All 15 of the most accurate stay above it, and all 15 of the least accurate stay below.
Head share. malbsMd leads at 30.7%, then dem0n (29.3%), mzinho (28.1%), jcobbb (27.9%) and esenthial (27.7%). donk is ninth at 26.9%.
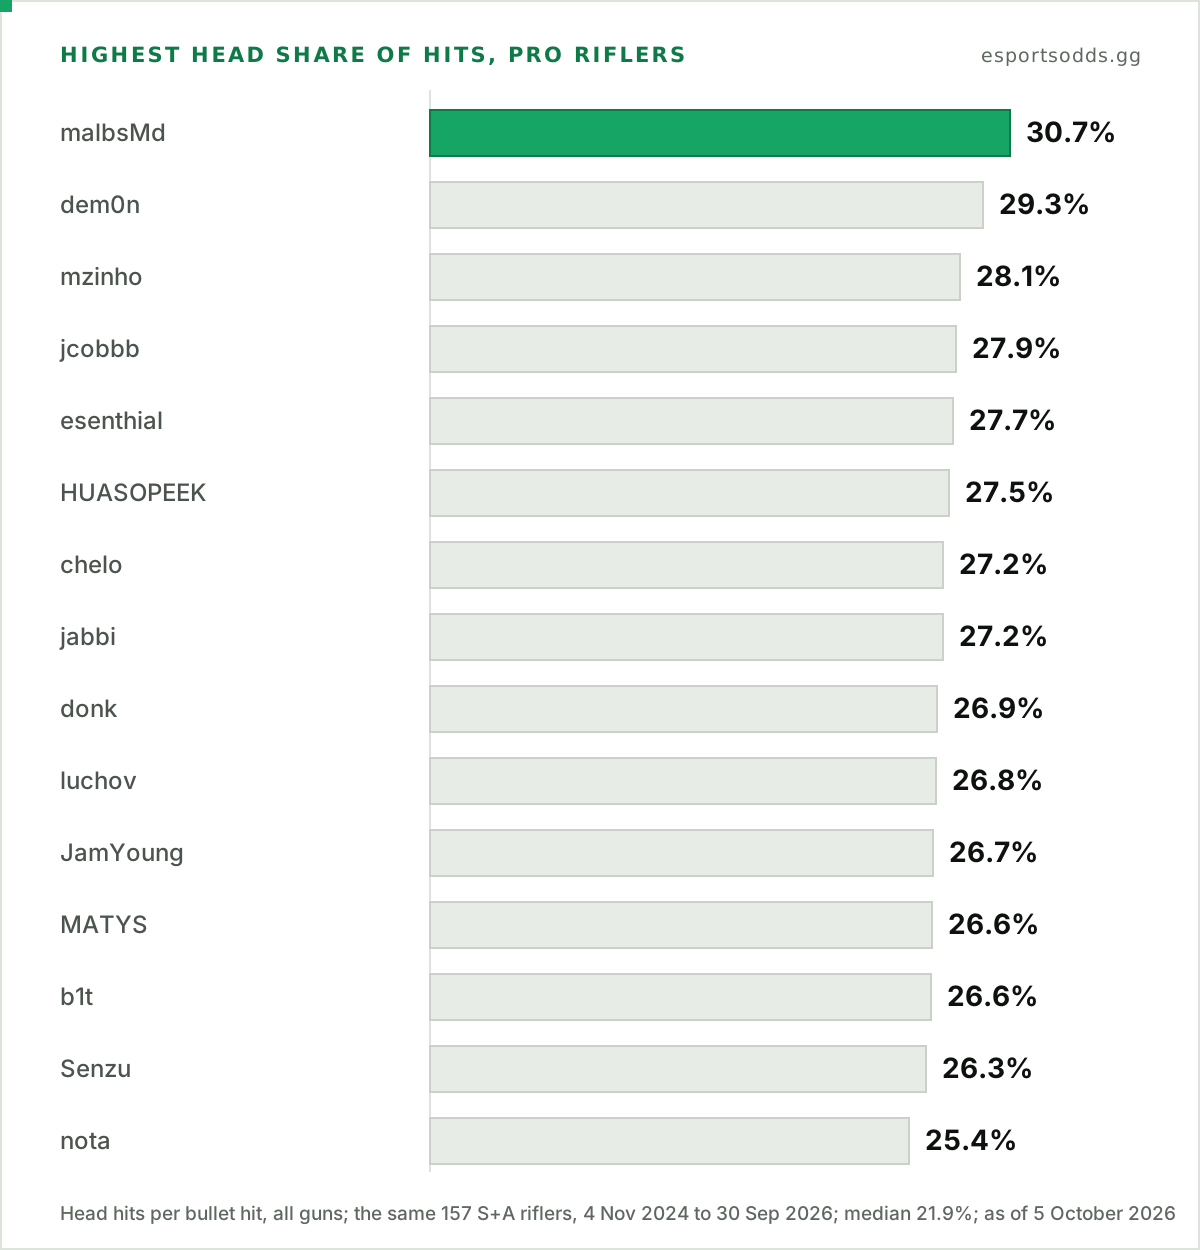
The intervals matter here too: head-share intervals run about 0.9 points either side, and malbsMd's 1.4-point lead over dem0n is borderline (95% interval from just under zero to +2.8 points), though his 2.6-point lead over mzinho is clear. Head share counts every gun, pistols included, so we repeated the check on rows where the five rifles made up at least 90% of a player's gun hits. Of the top 15, 13 are above the median of those rifle-dominant rows (20.5%), and the other 2 have too few such hits (under 300) to test. The step in headshot share when CS2 launched is covered in how the CS2 weapon meta moved, and every rifler is in the table at the end.
The AWP is judged on a different scale
The AWP hits roughly half its shots where a rifle hits a sixth, so AWPers get their own chart. League-wide, AWP shots in S and A tier events hit 47.1% of the time before 18 March 2026 and 48.7% from that day, when Valve's reload redesign shipped. Each player is therefore compared with the league's AWP rate in the months they actually played, not with one flat number.
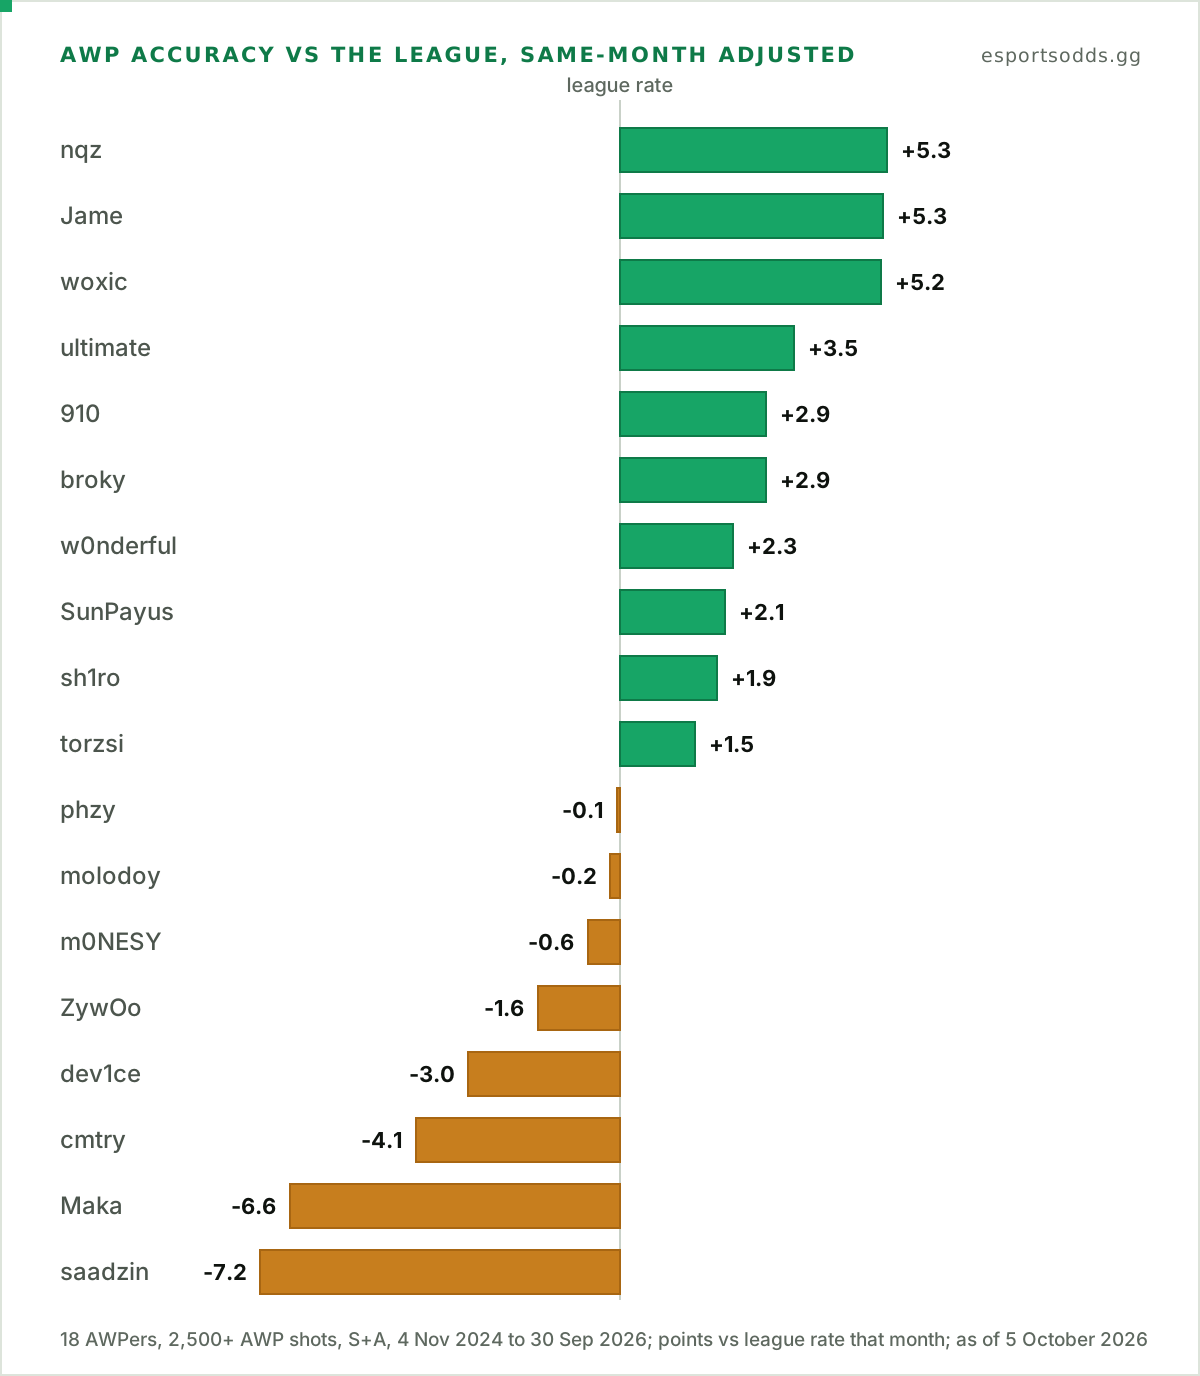
Of the 18 players with 2,500 or more AWP shots in the window, nqz (+5.3 points), Jame (+5.3) and woxic (+5.2) sit furthest above the league's rate, and Maka (−6.6) and saadzin (−7.2) furthest below. The group's median gap to the league's rate is +1.7 points; 10 of the 18 are above that rate and 8 below. ZywOo hits 46.1% of AWP shots and m0NESY 47.1%, both below the group's median hit rate of 49.4%, and the 90% intervals around each (44.9% to 47.3% and 45.9% to 48.3%) sit wholly under it. Against the league's own rate in the months they played, though, both point estimates are within two points of level: m0NESY at −0.6 points (90% interval −1.8 to +0.5, which includes zero) and ZywOo at −1.6 (−2.8 to −0.4, which does not). Both the raw and the league-adjusted comparison hold when the cutoff is 1,500 or 4,000 AWP shots (38 and 11 players). As with rifles, hit rate is one part of shooting, not a ranking of AWPers.
Where 11 million hits land
Zoom out from the players. In the window, our data records 10,986,907 bullet hits and 3,509,901 killing blows across 11,029 completed matches of every tier, with grenade, fire and other non-bullet damage excluded:
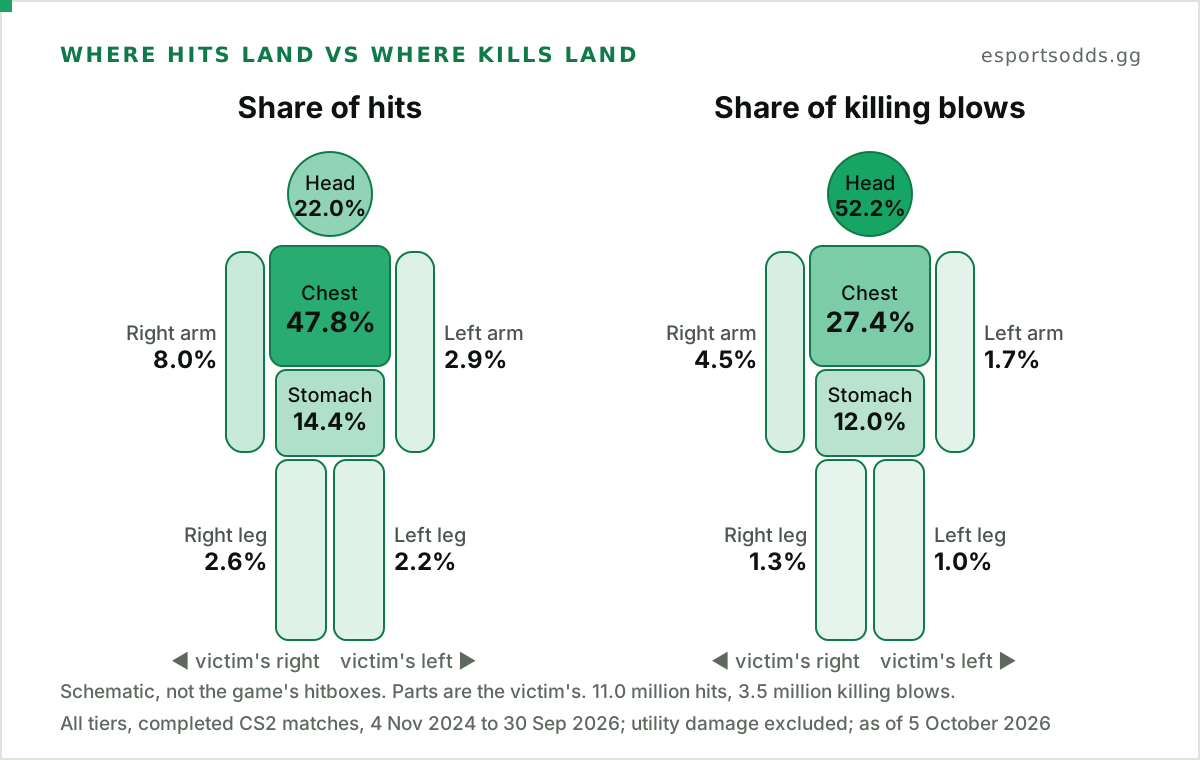
The chest takes 47.8% of hits and the head 22.0%, but the head decides the fights: 52.2% of killing blows were headshots, against 27.4% for the chest. Seen the other way round:
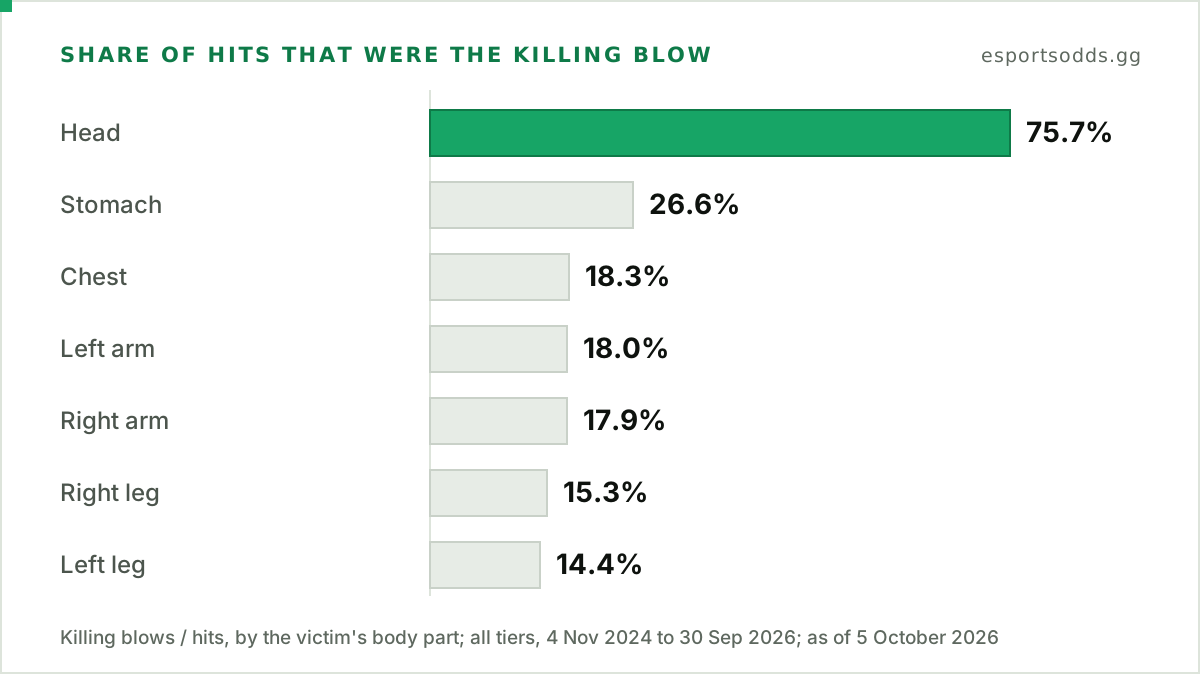
75.7% of head hits were the killing blow, against 18.3% of chest hits. A stomach hit finished the fight more often than a chest hit did (26.6%). Arms and legs together take 15.8% of hits and 8.4% of killing blows.
Cross-checks against our other tables mostly agree. Head kills are 52.2% of kills in the hit-group table against 51.5% on the scoreboard for the same player-matches. The hit-group record's gun hits run about 0.7% above our weapon tables' in the 10,975 matches with ordinary coverage, and we cannot tell whether teammate damage or penetrating bullets explain it. Row by row the two tables are noisier: across 43,587 S and A tier player-sides with at least 15 gun hits, 57.3% match exactly and 7.3% differ by more than 5%. Fifty-four matches are the exception, with almost no hit-group rows at all (see How we measured it).
The recorded right arm is hit 2.7 times as often as the left
The arms are the odd part of that body. The recorded right arm took 8.0% of hits and the left arm 2.9%: 2.7 right-arm hits for every left-arm hit. It is not a few players. All 186 S and A tier players with 4,000 or more bullet hits recorded more right-arm than left-arm hits, by 2.11 to 3.99 times (median 2.82).
One plausible explanation is that players hold their weapon in the right hand, so the right arm is more exposed when they peek. Per-match totals cannot test that. What they can show is that the number moves with the game's own rules: in online matches it fell overnight on the day Valve changed which hit plays the flinch animation when a bullet goes through two hitboxes of equal priority.
The day the recorded arm ratio fell
Valve's release notes for 28 October 2024, posted at 01 UTC on the 29th, include one line about hitboxes:
Enemies will now consistently play a flinch animation on the closest hit when the bullet goes through two hitboxes of equal priority (e.g. when both right and left legs get hit).
The recorded arm ratio fell the same day:
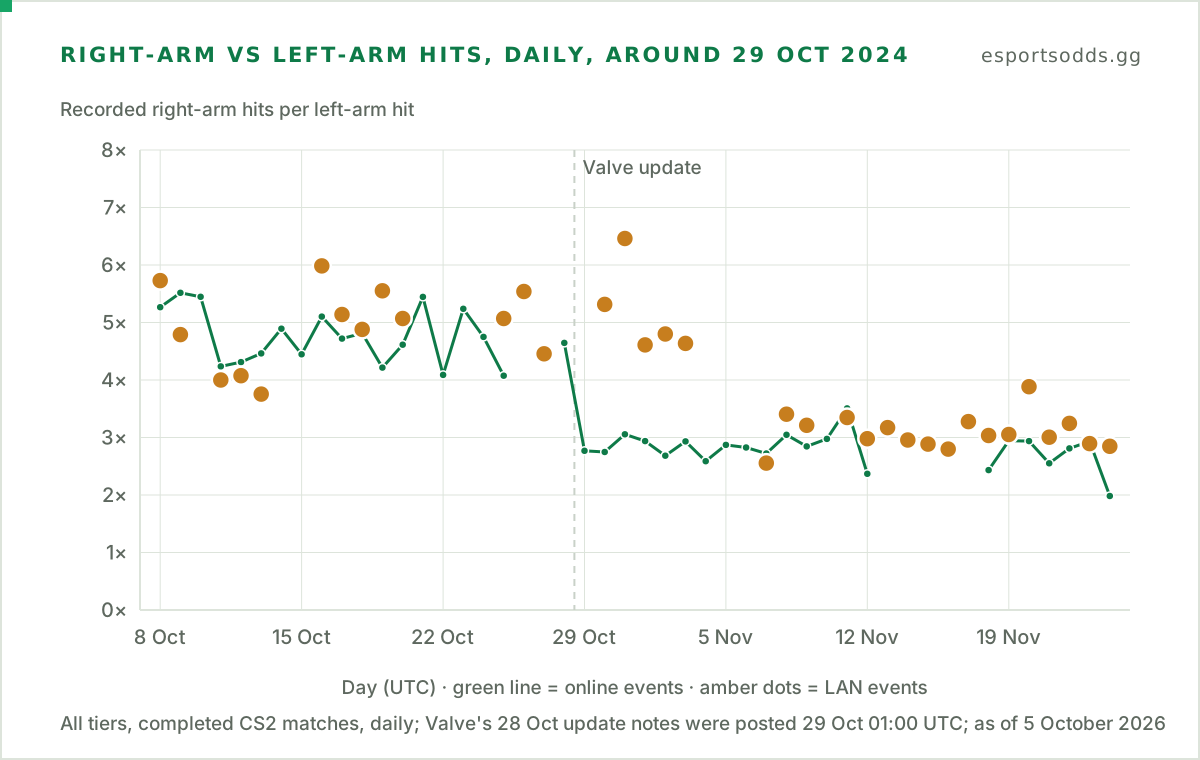
Online matches read 4.6 right-arm hits per left-arm hit on 28 October and 2.8 on 29 October, and stayed between 2.0 and 3.5 through 24 November. Compare 21 days either side (8 to 28 October against 4 to 24 November, every tier) and the shares of hits on the arms and on the legs barely moved:
| 8 to 28 Oct 2024 | 4 to 24 Nov 2024 | |
|---|---|---|
| Bullet hits | 213,158 | 244,479 |
| Head share of hits | 21.02% | 21.00% |
| Arms, share of hits | 10.94% | 10.88% |
| Legs, share of hits | 4.83% | 4.75% |
| Right-arm hits per left-arm hit | 4.90 | 2.95 |
| Right-leg hits per left-leg hit | 1.41 | 1.20 |
The share of hits landing on arms and on legs held; which arm or leg got the credit changed. Valve's own example is both legs, and the leg ratio moved the same way as the arm ratio. We cannot see the game's code, but a rule that resolves a bullet crossing two equal hitboxes differently would look like this: the split between left and right changes and the combined share barely does. Damage per hit is nearly the same on both sides: 23.74 for a right-arm hit and 23.77 for a left-arm hit, 21.0 for either leg. This is bookkeeping, not damage.
The mix of events did shift between those two windows (LAN events were 31.3% of hits before and 62.5% after), so we split the comparison. The right-to-left arm ratio fell in every group we can separate: from 4.98 to 3.08 at S and A tier (A tier only in the later window), 4.85 to 2.88 at B tier, 4.81 to 2.80 at online events and 5.13 to 3.05 at LAN events, and the arms' share of hits held between 10.7% and 11.0% in each. Head share did drift inside some groups, in opposite directions (S and A tier 20.84% to 20.05%, online events 21.11% to 21.94%), so the pooled 21.02% to 21.00% is flatter than its parts.
Nor did it fade:
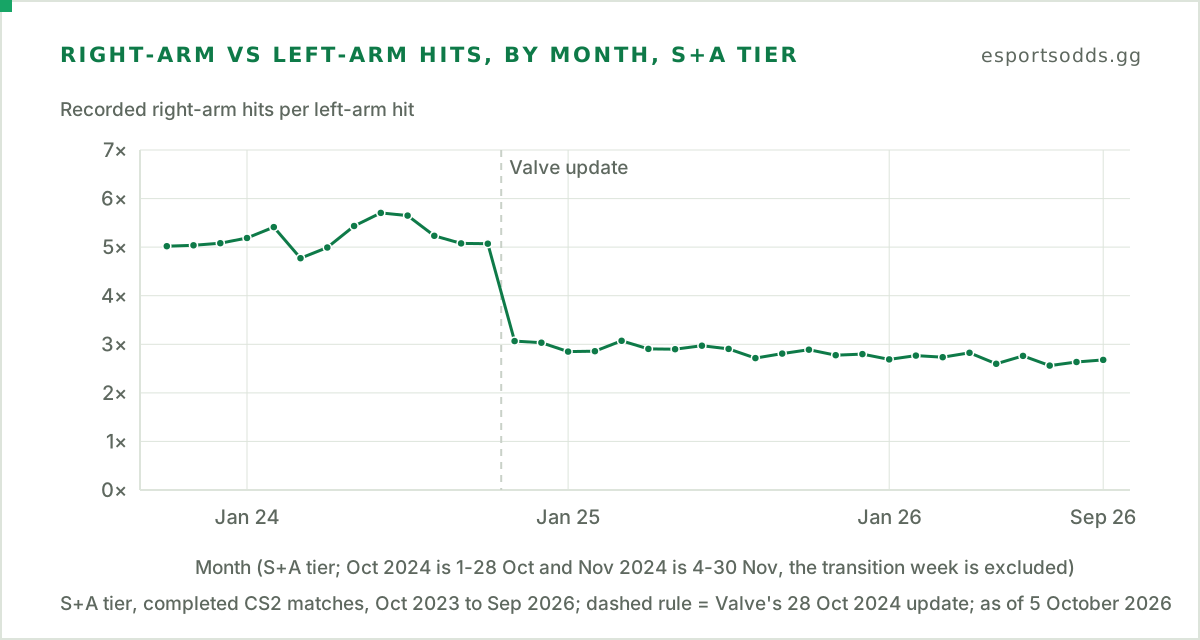
Every S and A tier month before the update sits between 4.8 and 5.7 right-arm hits per left-arm hit, and every month since sits between 2.6 and 3.1.
One wrinkle, which is a guess rather than a finding. In the week after the update (29 October to 3 November), the 17 LAN matches, all from two S-tier events, kept the old ratio (5.15 for arms and 1.45 for legs), while the 59 online matches, all from B-tier events, read 2.87 and 1.21. LAN matches from 4 November onward read about 3. That fits a LAN event running an older game build until it finishes, but tier is tangled up with it, so we do not lean on it.
The recorded split may have moved again in 2026. Comparing the six weeks before 20 April with the six weeks after (every tier), the arms' share of hits rose from 10.81% to 11.43%, the right-to-left leg ratio rose from 1.19 to 1.28 and the right-to-left arm ratio slipped from 2.77 to 2.61, and the arms' rise shows up in each of the four groups used above (S and A tier, B tier, online events and LAN events: +0.55 to +0.73 points). Valve's notes for 20 April say that every change from the Animgraph 2 beta went live that day, and the 1 April beta announcement describes Animgraph 2 as a new animation system in which all third-person animations were re-authored. Of the 613 split dates we can test, the eight biggest rises in the arms' share and in the leg ratio all fall between 14 and 22 April, so the shift is one of the largest in the window but not pinned to one day (20 April itself ranks fifth for the arms' share and fourth for the leg ratio): Valve also shipped a recoil-camera change on 21 April and more Animgraph 2 fixes on 22 and 24 April, and the hit-group record cannot separate them. A single-rifle control is too thin to settle it, and we picked 20 April after seeing the data, which is why we ranked it against every other date. Read it as a coincidence worth watching, not a cause.
AK-47 head hits finish the fight more often than M4 head hits
Last, the guns. Take the player-sides that used a single rifle for at least 90% of their gun hits (a player-side is everything one player did on the T side, or on the CT side, across a whole match, with at least 15 gun hits), and ask how often a head hit was also the killing blow:
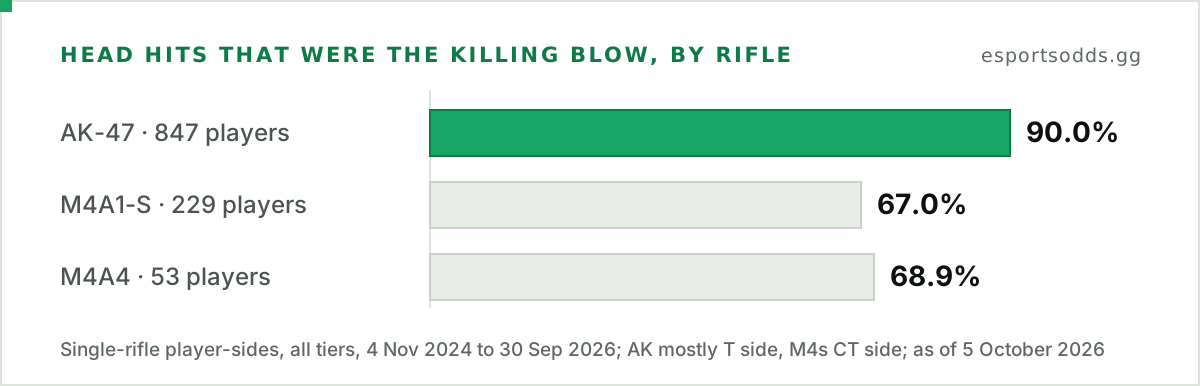
The AK-47's head hit finished the job 90.0% of the time (95% CI 89.5% to 90.5%), from 15,827 head hits by 847 players. The M4A1-S managed 67.0% (64.9% to 69.1%; 1,938 head hits, 229 players) and the M4A4 68.9% (64.9% to 73.3%; 438 head hits, 53 players). The AK-47 is 23.0 points ahead of the M4A1-S (20.8 to 25.1), while the two M4s cannot be told apart on this measure (+1.9 points, −2.6 to +6.7).
That comparison has a hole: gun and side are tangled. The AK-47 is a T-side gun and the M4s are CT-side guns. 99.8% of the AK-47 rows that pass this filter are T-side and every M4 row is CT-side, with only 4 CT-side AK-47 rows to test, although across all AK-47 kills about 75% are T-side. So here is a second cut that uses every kill in the weapon table, not only single-rifle rows, and compares guns within a side. The measure changes to headshots as a share of kills, because the hit-group record does not say which gun fired:
| Rifle and side | Players | Kills | Headshots, share of kills | 95% interval | Wallbangs, share of kills |
|---|---|---|---|---|---|
| AK-47, CT side | 3,129 | 313,908 | 54.6% | 54.2% to 55.0% | 4.0% |
| AK-47, T side | 3,266 | 941,057 | 61.2% | 60.9% to 61.5% | 4.1% |
| M4A1-S, CT side | 3,214 | 611,131 | 40.7% | 40.4% to 41.1% | 3.9% |
| M4A1-S, T side | 2,554 | 38,009 | 49.1% | 48.5% to 49.7% | 4.0% |
| M4A4, CT side | 2,629 | 215,376 | 47.5% | 47.1% to 48.0% | 4.1% |
| M4A4, T side | 2,047 | 12,599 | 55.5% | 54.6% to 56.5% | 4.3% |
The AK-47, M4A4 and M4A1-S each read 6.6 to 8.3 points higher on the T side, so side alone is worth about that much. But the AK-47 stays ahead on both sides, by 13.9 points over the M4A1-S on the CT side (13.3 to 14.4) and 12.1 on the T side (11.4 to 12.8), with the M4A4 in between. Wallbangs were 3.9% to 4.3% of kills for each of the three rifles, so they do not explain it. The same ordering appears in our all-era weapon study, which measures headshots as a share of kills across every era.
Valve's weapon files are consistent with a gun effect. A head hit on a helmeted opponent does 36 × 4.0 × (1.55 × 0.5) = 111.6 damage with the AK-47, enough to kill from full health, but 38 × 3.475 × (1.4 × 0.5) = 92.4 with the M4A1-S and 33 × 4.0 × (1.4 × 0.5) = 92.4 with the M4A4, which is not. Those values were identical across our whole window.
Stability over time does not separate gun from side, but it shows the gap is no one-patch artefact. In S-tier matches since 2021, CS and CS2 alike, the AK-47's single-rifle rate stays between 87% and 93% in every half-year, and the M4A1-S's between 59% and 73% in the 5 half-years with enough head hits to show, with the AK-47 ahead in each of those 5.
What this data cannot see
Everything here comes from per-match totals, which sets hard limits.
- No distance, round or situation. A long-range spray, a point-blank tap and a shot into smoke all look alike in a match total.
- No pose. Whether the target was crouching, moving or jumping changes which part is exposed, and none of it is recorded.
- Everyone here is a professional. A pro sample is already selected for aim, and that kind of selection can hide or distort a link that exists among all players. Offsetting habits could also cancel out, such as spraying at close range (many hits, mostly body) against tapping at range (fewer hits, more heads). These data cannot tell those cases apart.
- Head share spans every gun. Hit rate covers rifles only, while head share includes pistols, SMGs and the AWP.
- Small gaps remain in the tables. Kills in the weapon table sit 0.25% below the scoreboard's, and hit-group damage runs 1.85% above the scoreboard's damage, which may be damage to teammates that the weapon table nets out and the hit-group table does not.
- The body part is the game's bookkeeping. The recorded split moved in October 2024, and a shift in April 2026 may have moved it again. Treat the arm numbers as a measure of how the game records hits, not of how players aim.
- Left and right are the record's labels. We take the record's right arm to be the victim's own right arm, as in the diagram; nothing in our data lets us check that independently.
- The M4A1-S is an inference. Our weapon table has two M4 slugs, m4a1 and m4a4, and we read m4a1 as the M4A1-S. Its higher damage per hit than the M4A4's (29.25 against 28.24) fits, but the records do not say so. The AK-47 comparison holds either way, because both M4s do the same 92.4 damage to a helmeted head.
- Gun and side are tangled in the single-rifle comparison. The all-kills table above separates them, but only through a different measure, headshots as a share of kills.
The verdict
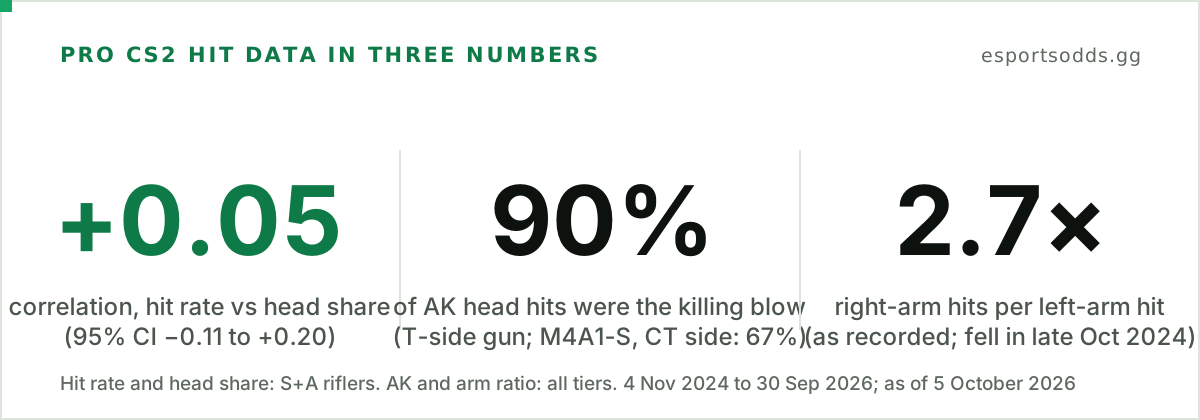
The shorthand that a good aimer is someone who hits heads folds two separate things together: how often shots land, and where. In this sample each is stable from year to year and follows a player between teams, and the two show no detectable link, although a small one cannot be ruled out. Beneath them, the body-part record is the game's own bookkeeping: it moved once for certain in late 2024 and may have moved again in 2026.
For related studies, see what the AWP nerf actually changed, how the weapon meta moved, which weapons decide rounds and what ADR does and does not tell you. The per-match weapon (shots and hits) and hit-group records behind this one are served by the API's match depth endpoint for most matches, so the same analysis can be run on your own cuts.
How we measured it
- Window. Completed matches with game version
cs2, scheduled from 4 November 2024 to 30 September 2026 (UTC): 11,029 matches and 3,207 players with hit-group records. That is 82.2% of the 13,418 completed matches in the window, and 99.4% at S and A tier; the rest have no bullet hits recorded by body part. The window begins after the 28 October 2024 update and the week that followed it, when LAN matches still showed the old arm ratio, and stops before the current, still-filling month. Three things use other windows, each stated where it appears: the daily patch chart (8 October to 24 November 2024), the monthly one (October 2023 to September 2026) and the half-year check on the AK-47 and M4A1-S (S-tier matches since 2021, CS included). - Tiers. Tier is an event's prestige grade: S highest, then A, B and C. Player sections use S and A tier events (2,315 matches). The body, lethality, one-tap and gun-by-side sections use every tier for sample size. The daily patch chart uses every tier too, but because the mix of events shifted between its two windows we also checked it by tier and event type, as above; the monthly chart uses S and A tier.
- Bullet hits. Body-part hits recorded for a player, from per-match hit-group records, with grenade, fire and other non-bullet damage excluded. The body part is the victim's, and a killing blow is the hit group of the bullet that took the last health point. The records may include a sliver of damage to teammates, which this data cannot separate.
- Rifler. At least 16,000 rifle shots with the AWP under 5% of the player's gun hits: 157 players. The threshold counts shots fired, not hits, so it does not select on hit rate directly. Among the 157, though, shots fired and hit rate do correlate (−0.26 against the log of shots fired), which is why the table above also tests 12,000 and 24,000. AWPer: at least 2,500 AWP shots.
- Intervals. Correlation intervals are Fisher-z 95% intervals. Player-level 90% intervals, used for the quadrants and the AWP comparison with the median, come from a match-level bootstrap (2,000 resamples, fixed seed) that keeps a player's hits within one match together; a player or two whose interval ends near a median can switch group under another seed. The comparisons between named players at the top of the two lists resample each player's matches separately (40,000 resamples) and take the 95% interval of the difference. The one-tap and gun-by-side intervals resample players (40,000 resamples), so one player with hundreds of rows does not count as hundreds of independent observations.
- Stability. Year one is 4 November 2024 to 31 October 2025 and year two is 1 November 2025 to 30 September 2026. A team change means the team a player appeared for in the most matches differed between the years (a tie goes to the team they played for first). The split-half figures average 1,000 random splits of each player's matches into two halves, with a fixed seed; they are not an early half against a late one. The half-year check shows a half-year only where a rifle has at least 100 head hits, and counts CS and CS2 separately in the second half of 2023.
- Scoreboard figures. ADR is total damage per round, K/D is total kills over total deaths and KAST is the round-weighted average of per-match KAST, each over the same S and A tier matches.
- Gaps in the records. In 54 of the 11,029 matches (all played 22 to 26 January 2026, from six events) the hit-group record is almost empty, and 7 pairs of matches carry identical player totals under different match IDs, so one match in each pair is probably counted twice. We left both in, because the API serves the same records; dropping the 54 and the 7 surplus copies removes 1 player from the 157 and leaves the correlation at +0.05.
- Rounding. Percentages are rounded once, from raw counts.
Counts come from per-match weapon and hit-group records in our dataset. See our methodology page for how our data is sourced.
Appendix: all 157 riflers
Alphabetical. Matches, rifle shots, rifle hits, head hits and bullet hits are over the window; hit rate is rifle hits per rifle shot, and head share is head hits per bullet hit, from every gun. To ask for a name or a figure to be corrected or removed, see our player data notice.
| Player | Matches | Rifle shots | Rifle hits | Hit rate | Head hits | Bullet hits | Head share |
|---|---|---|---|---|---|---|---|
| 1eeR | 42 | 18,793 | 2,620 | 13.9% | 739 | 3,757 | 19.7% |
| adamb | 41 | 17,759 | 3,326 | 18.7% | 943 | 4,258 | 22.1% |
| Ag1l | 45 | 19,611 | 3,960 | 20.2% | 1,030 | 5,149 | 20.0% |
| Aleksib | 128 | 50,212 | 8,307 | 16.5% | 2,181 | 12,996 | 16.8% |
| alex | 40 | 24,417 | 3,635 | 14.9% | 749 | 4,075 | 18.4% |
| alex666 | 118 | 61,277 | 8,654 | 14.1% | 2,218 | 11,515 | 19.3% |
| apEX | 146 | 100,286 | 11,841 | 11.8% | 2,975 | 15,082 | 19.7% |
| arT | 64 | 32,466 | 4,342 | 13.4% | 1,199 | 6,421 | 18.7% |
| AW | 51 | 21,141 | 3,727 | 17.6% | 1,213 | 5,701 | 21.3% |
| Ax1Le | 46 | 24,593 | 3,863 | 15.7% | 933 | 4,947 | 18.9% |
| AZUWU | 56 | 26,929 | 3,921 | 14.6% | 1,295 | 5,218 | 24.8% |
| b1t | 128 | 60,780 | 10,728 | 17.7% | 3,812 | 14,346 | 26.6% |
| BELCHONOKK | 78 | 29,529 | 6,551 | 22.2% | 1,641 | 8,423 | 19.5% |
| biguzera | 123 | 59,289 | 8,485 | 14.3% | 2,637 | 11,750 | 22.4% |
| blameF | 63 | 31,710 | 5,188 | 16.4% | 1,180 | 6,727 | 17.5% |
| bLitz | 145 | 86,057 | 12,447 | 14.5% | 3,170 | 16,208 | 19.6% |
| bodyy | 100 | 64,906 | 7,753 | 11.9% | 2,393 | 10,448 | 22.9% |
| Boombl4 | 89 | 40,046 | 6,459 | 16.1% | 1,444 | 9,284 | 15.6% |
| br0 | 48 | 19,840 | 3,320 | 16.7% | 1,033 | 4,499 | 23.0% |
| brnz4n | 62 | 21,078 | 3,757 | 17.8% | 1,259 | 5,096 | 24.7% |
| Brollan | 126 | 53,744 | 9,781 | 18.2% | 2,890 | 14,124 | 20.5% |
| C4LLM3SU3 | 59 | 19,608 | 3,314 | 16.9% | 1,034 | 4,656 | 22.2% |
| cairne | 42 | 22,082 | 4,083 | 18.5% | 1,128 | 5,366 | 21.0% |
| chelo | 55 | 25,327 | 3,468 | 13.7% | 1,375 | 5,054 | 27.2% |
| chopper | 81 | 31,282 | 4,783 | 15.3% | 1,852 | 7,603 | 24.4% |
| Chr1zN | 65 | 30,204 | 4,401 | 14.6% | 1,620 | 6,692 | 24.2% |
| cobrazera | 56 | 28,194 | 4,414 | 15.7% | 1,451 | 5,961 | 24.3% |
| cxzi | 33 | 16,859 | 2,503 | 14.8% | 653 | 3,721 | 17.5% |
| d1Ledez | 55 | 20,551 | 3,780 | 18.4% | 1,122 | 4,679 | 24.0% |
| dav1deuS | 82 | 41,184 | 6,732 | 16.3% | 2,039 | 9,198 | 22.2% |
| dav1g | 40 | 20,746 | 3,694 | 17.8% | 670 | 4,045 | 16.6% |
| Dawy | 33 | 19,416 | 3,298 | 17.0% | 834 | 4,197 | 19.9% |
| dem0n | 73 | 32,739 | 5,917 | 18.1% | 2,227 | 7,594 | 29.3% |
| dgt | 88 | 50,336 | 7,793 | 15.5% | 2,084 | 9,526 | 21.9% |
| donk | 134 | 80,353 | 14,426 | 18.0% | 4,656 | 17,328 | 26.9% |
| dumau | 108 | 72,256 | 10,174 | 14.1% | 2,248 | 13,351 | 16.8% |
| dziugss | 73 | 36,237 | 6,393 | 17.6% | 1,851 | 8,205 | 22.6% |
| electronic | 73 | 28,216 | 5,251 | 18.6% | 1,428 | 8,014 | 17.8% |
| EliGE | 113 | 58,758 | 9,874 | 16.8% | 2,666 | 12,639 | 21.1% |
| EmiliaQAQ | 64 | 18,311 | 3,616 | 19.7% | 1,265 | 5,081 | 24.9% |
| esenthial | 118 | 57,263 | 7,417 | 13.0% | 2,890 | 10,427 | 27.7% |
| Ex3rcice | 128 | 46,492 | 10,137 | 21.8% | 2,799 | 12,840 | 21.8% |
| exit | 57 | 24,468 | 3,840 | 15.7% | 973 | 5,102 | 19.1% |
| fame | 78 | 27,649 | 5,980 | 21.6% | 1,978 | 7,953 | 24.9% |
| fEAR | 47 | 18,790 | 2,911 | 15.5% | 800 | 4,493 | 17.8% |
| FL1T | 77 | 38,908 | 6,391 | 16.4% | 1,656 | 8,377 | 19.8% |
| FL4MUS | 95 | 37,699 | 7,163 | 19.0% | 2,345 | 9,601 | 24.4% |
| flameZ | 146 | 74,660 | 11,953 | 16.0% | 3,804 | 17,738 | 21.4% |
| frozen | 146 | 66,306 | 13,306 | 20.1% | 3,395 | 17,288 | 19.6% |
| Graviti | 152 | 55,816 | 9,697 | 17.4% | 3,747 | 15,564 | 24.1% |
| Grim | 77 | 27,762 | 5,605 | 20.2% | 1,745 | 8,566 | 20.4% |
| HeavyGod | 148 | 75,628 | 12,478 | 16.5% | 3,875 | 17,312 | 22.4% |
| HooXi | 104 | 46,430 | 6,756 | 14.6% | 2,252 | 9,974 | 22.6% |
| HUASOPEEK | 48 | 25,114 | 3,692 | 14.7% | 1,353 | 4,914 | 27.5% |
| huNter- | 139 | 62,408 | 10,486 | 16.8% | 3,073 | 14,815 | 20.7% |
| iM | 128 | 82,862 | 13,166 | 15.9% | 2,771 | 16,430 | 16.9% |
| INS | 61 | 28,317 | 4,102 | 14.5% | 1,095 | 5,805 | 18.9% |
| insani | 95 | 41,904 | 7,890 | 18.8% | 2,161 | 9,842 | 22.0% |
| jabbi | 143 | 59,235 | 11,026 | 18.6% | 4,017 | 14,769 | 27.2% |
| JamYoung | 76 | 28,518 | 5,445 | 19.1% | 1,971 | 7,395 | 26.7% |
| JBa | 61 | 21,484 | 3,643 | 17.0% | 1,220 | 5,308 | 23.0% |
| jcobbb | 79 | 30,536 | 5,928 | 19.4% | 2,114 | 7,582 | 27.9% |
| JDC | 75 | 33,739 | 6,395 | 19.0% | 1,585 | 8,142 | 19.5% |
| Jimpphat | 123 | 58,701 | 10,995 | 18.7% | 2,768 | 14,386 | 19.2% |
| jks | 58 | 20,981 | 3,752 | 17.9% | 1,257 | 5,243 | 24.0% |
| jL | 60 | 36,254 | 4,453 | 12.3% | 1,475 | 6,162 | 23.9% |
| jottAAA | 97 | 44,353 | 8,321 | 18.8% | 2,445 | 10,847 | 22.5% |
| JT | 71 | 37,559 | 4,972 | 13.2% | 1,389 | 6,666 | 20.8% |
| karrigan | 146 | 55,385 | 8,957 | 16.2% | 2,746 | 13,073 | 21.0% |
| kensizor | 113 | 47,389 | 8,135 | 17.2% | 2,799 | 11,645 | 24.0% |
| Krabeni | 73 | 35,169 | 6,135 | 17.4% | 1,940 | 8,034 | 24.1% |
| Krimbo | 62 | 26,061 | 4,691 | 18.0% | 1,280 | 6,221 | 20.6% |
| KRIMZ | 56 | 26,531 | 4,529 | 17.1% | 996 | 5,966 | 16.7% |
| KSCERATO | 168 | 104,247 | 15,914 | 15.3% | 4,351 | 20,706 | 21.0% |
| Kvem | 36 | 28,434 | 3,283 | 11.5% | 972 | 4,072 | 23.9% |
| kyousuke | 85 | 45,484 | 8,355 | 18.4% | 2,530 | 10,227 | 24.7% |
| kyxsan | 125 | 46,642 | 9,296 | 19.9% | 2,770 | 13,421 | 20.6% |
| lake | 69 | 29,770 | 5,279 | 17.7% | 1,358 | 7,169 | 18.9% |
| latto | 108 | 65,300 | 9,398 | 14.4% | 2,684 | 12,047 | 22.3% |
| lauNX | 49 | 21,428 | 4,160 | 19.4% | 1,263 | 5,734 | 22.0% |
| Liazz | 42 | 20,797 | 2,884 | 13.9% | 745 | 4,096 | 18.2% |
| LNZ | 112 | 36,815 | 7,251 | 19.7% | 2,257 | 10,648 | 21.2% |
| Lucaozy | 53 | 23,811 | 3,886 | 16.3% | 1,012 | 5,057 | 20.0% |
| luchov | 42 | 21,182 | 3,418 | 16.1% | 1,227 | 4,572 | 26.8% |
| Lucky | 152 | 83,024 | 12,803 | 15.4% | 2,944 | 16,423 | 17.9% |
| lux | 79 | 46,163 | 5,723 | 12.4% | 1,493 | 7,551 | 19.8% |
| Magisk | 80 | 46,916 | 6,677 | 14.2% | 1,946 | 8,902 | 21.9% |
| magixx | 103 | 42,952 | 6,865 | 16.0% | 2,220 | 10,545 | 21.1% |
| Magnojez | 84 | 48,854 | 7,153 | 14.6% | 1,958 | 9,379 | 20.9% |
| MAJ3R | 136 | 57,650 | 8,475 | 14.7% | 2,814 | 13,710 | 20.5% |
| makazze | 95 | 59,741 | 9,430 | 15.8% | 2,356 | 11,930 | 19.7% |
| malbsMd | 123 | 63,057 | 9,301 | 14.8% | 3,628 | 11,811 | 30.7% |
| MATYS | 114 | 46,216 | 9,199 | 19.9% | 3,167 | 11,898 | 26.6% |
| max | 48 | 20,617 | 3,212 | 15.6% | 1,029 | 4,696 | 21.9% |
| Mercury | 76 | 26,945 | 5,355 | 19.9% | 1,595 | 7,206 | 22.1% |
| mezii | 140 | 71,818 | 11,001 | 15.3% | 3,449 | 14,436 | 23.9% |
| misutaaa | 52 | 22,239 | 4,556 | 20.5% | 1,307 | 5,438 | 24.0% |
| mopoz | 40 | 17,511 | 3,064 | 17.5% | 882 | 4,075 | 21.6% |
| Moseyuh | 76 | 23,844 | 5,568 | 23.4% | 1,600 | 7,290 | 21.9% |
| MUTiRiS | 54 | 28,732 | 3,860 | 13.4% | 1,133 | 5,144 | 22.0% |
| mzinho | 136 | 62,059 | 10,257 | 16.5% | 3,861 | 13,747 | 28.1% |
| n1ssim | 104 | 52,583 | 7,799 | 14.8% | 2,298 | 10,621 | 21.6% |
| NAF | 112 | 60,021 | 8,460 | 14.1% | 2,156 | 12,319 | 17.5% |
| Neityu | 57 | 27,544 | 4,897 | 17.8% | 1,212 | 6,494 | 18.7% |
| Nertz | 133 | 81,657 | 12,267 | 15.0% | 3,315 | 16,046 | 20.7% |
| nettik | 44 | 17,018 | 2,882 | 16.9% | 929 | 4,170 | 22.3% |
| nicx | 54 | 18,109 | 3,431 | 18.9% | 1,208 | 4,959 | 24.4% |
| NiKo | 142 | 87,664 | 13,808 | 15.8% | 3,722 | 16,654 | 22.3% |
| nilo | 73 | 35,453 | 6,856 | 19.3% | 2,088 | 8,426 | 24.8% |
| nota | 71 | 31,403 | 5,535 | 17.6% | 1,771 | 6,967 | 25.4% |
| npl | 118 | 60,858 | 9,347 | 15.4% | 2,963 | 12,157 | 24.4% |
| piriajr | 43 | 18,698 | 3,180 | 17.0% | 973 | 4,148 | 23.5% |
| PR | 121 | 57,485 | 11,378 | 19.8% | 2,916 | 14,617 | 19.9% |
| rain | 84 | 47,476 | 6,788 | 14.3% | 2,001 | 8,897 | 22.5% |
| REZ | 122 | 65,958 | 10,756 | 16.3% | 3,220 | 13,740 | 23.4% |
| riskyb0b | 42 | 18,782 | 2,597 | 13.8% | 825 | 3,685 | 22.4% |
| ropz | 152 | 64,715 | 13,809 | 21.3% | 3,795 | 17,380 | 21.8% |
| ryu | 54 | 20,881 | 4,658 | 22.3% | 1,217 | 5,997 | 20.3% |
| s1n | 69 | 26,835 | 3,864 | 14.4% | 1,207 | 5,474 | 22.0% |
| s1ren | 75 | 31,499 | 5,262 | 16.7% | 1,548 | 7,083 | 21.9% |
| sausol | 40 | 21,478 | 3,897 | 18.1% | 889 | 4,230 | 21.0% |
| sdy | 31 | 16,365 | 2,735 | 16.7% | 631 | 3,894 | 16.2% |
| Senzu | 91 | 73,181 | 7,534 | 10.3% | 2,541 | 9,664 | 26.3% |
| siuhy | 89 | 41,093 | 6,362 | 15.5% | 1,761 | 8,389 | 21.0% |
| sjuush | 88 | 41,658 | 7,133 | 17.1% | 1,969 | 9,346 | 21.1% |
| skullz | 57 | 22,941 | 3,820 | 16.7% | 1,224 | 5,248 | 23.3% |
| Snappi | 72 | 28,962 | 3,755 | 13.0% | 1,571 | 6,830 | 23.0% |
| Snax | 91 | 40,282 | 5,975 | 14.8% | 1,487 | 9,019 | 16.5% |
| snow | 125 | 49,587 | 8,994 | 18.1% | 2,622 | 13,235 | 19.8% |
| Sonic | 67 | 35,959 | 4,891 | 13.6% | 1,316 | 6,515 | 20.2% |
| soulfly | 47 | 17,714 | 3,634 | 20.5% | 1,142 | 5,263 | 21.7% |
| Spinx | 141 | 85,453 | 13,185 | 15.4% | 3,877 | 16,546 | 23.4% |
| Staehr | 143 | 89,389 | 12,888 | 14.4% | 3,653 | 16,806 | 21.7% |
| Starry | 64 | 27,719 | 4,110 | 14.8% | 1,301 | 5,360 | 24.3% |
| susp | 75 | 36,254 | 5,822 | 16.1% | 1,645 | 7,999 | 20.6% |
| Swisher | 69 | 29,663 | 4,546 | 15.3% | 1,213 | 6,509 | 18.6% |
| tabseN | 75 | 31,001 | 5,168 | 16.7% | 1,590 | 7,505 | 21.2% |
| Tauson | 134 | 55,292 | 10,546 | 19.1% | 2,760 | 14,215 | 19.4% |
| Techno4K | 143 | 66,845 | 9,630 | 14.4% | 3,586 | 14,131 | 25.4% |
| TeSeS | 142 | 67,528 | 11,572 | 17.1% | 3,766 | 15,177 | 24.8% |
| tN1R | 119 | 49,199 | 9,690 | 19.7% | 3,226 | 13,076 | 24.7% |
| Twistzz | 135 | 60,534 | 11,178 | 18.5% | 3,673 | 14,768 | 24.9% |
| Vexite | 61 | 21,047 | 4,023 | 19.1% | 1,361 | 5,953 | 22.9% |
| Westmelon | 64 | 19,714 | 3,694 | 18.7% | 1,233 | 5,298 | 23.3% |
| Wicadia | 147 | 69,675 | 12,701 | 18.2% | 4,134 | 18,053 | 22.9% |
| Xant3r | 42 | 19,519 | 3,119 | 16.0% | 941 | 4,151 | 22.7% |
| XANTARES | 144 | 90,805 | 13,664 | 15.0% | 4,147 | 17,731 | 23.4% |
| xertioN | 147 | 85,519 | 14,266 | 16.7% | 3,730 | 18,361 | 20.3% |
| xfl0ud | 109 | 70,388 | 9,979 | 14.2% | 2,668 | 12,974 | 20.6% |
| xiELO | 86 | 37,761 | 6,556 | 17.4% | 2,135 | 8,808 | 24.2% |
| xKacpersky | 87 | 63,604 | 7,900 | 12.4% | 2,148 | 10,244 | 21.0% |
| YEKINDAR | 144 | 72,851 | 11,991 | 16.5% | 3,955 | 16,079 | 24.6% |
| yuurih | 168 | 111,495 | 15,526 | 13.9% | 3,590 | 20,690 | 17.4% |
| yxngstxr | 115 | 34,911 | 7,492 | 21.5% | 2,517 | 10,966 | 23.0% |
| zont1x | 118 | 48,284 | 10,242 | 21.2% | 2,038 | 13,764 | 14.8% |
| ztr | 98 | 37,627 | 6,488 | 17.2% | 1,832 | 10,132 | 18.1% |
| zweih | 121 | 64,142 | 9,811 | 15.3% | 2,734 | 13,070 | 20.9% |