Bottom line: People have been posting "CS2 weapon usage" charts for nine years without ever saying what usage means. We measured two things that can be defined precisely, kill share and shots fired, across 5,897 top-tier matches and 1.94 million kills from 2021 to mid-2026. The AK-47 has barely moved in five and a half years. The M4 platform has swung hard four times. The Desert Eagle lost 57% of its share of kills and almost nobody noticed. Every figure here is computed from the EsportsOdds CS2 data API as of 3 August 2026.
The question nobody answered
Ask what weapon is most used in professional Counter-Strike and you will find charts going back to 2017. Ask what "used" means and the trail goes cold. The most-upvoted version of this chart drew a comment asking whether usage meant kills, time equipped, purchases at round start, or shots fired. It was never answered. The author of a later attempt said in his own thread that he did not know how the number he was plotting had been calculated.
That is not a small gap. Those four definitions disagree with each other, sometimes by an order of magnitude, and the disagreement is the interesting part.
So this piece measures two things that have unambiguous definitions:
- Kill share: what percentage of all kills a weapon accounts for.
- Shots-fired share: what percentage of all bullets leaving guns came from it.
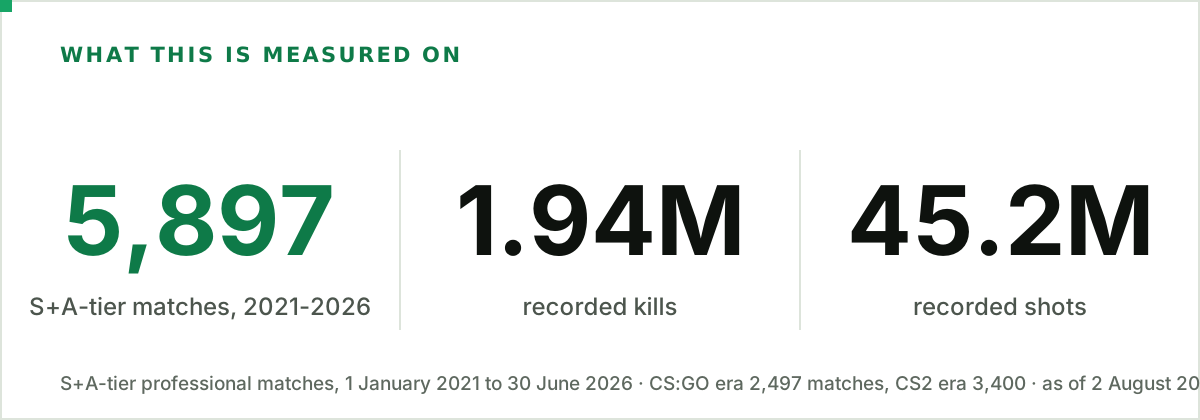
One scope limitation belongs up front rather than in a footnote. Our weapon data is per-match aggregates, not parsed demo files, so this measures kill output and shots fired, not pick rate or time held. If a gun gets bought more often but kills at the same rate, nothing here will catch it.
A second one matters just as much. Every time series below is restricted to S and A-tier events, and the long arc is S-tier only. That is not fussiness. Tier composition in our corpus swings violently, quarter to quarter as well as year to year: the first quarter of 2021 is 85.5% S-tier matches, while quarters between 2023 and 2026 run 64% to 83% B-tier. An all-tier trend line spanning those years would mostly be measuring which tournaments happened to run.
Every gun, plotted
Start with the whole armoury rather than one gun: every weapon's share of all kills, quarter by quarter, from 2021 to mid-2026. The dashed rule in every panel is CS2's launch.
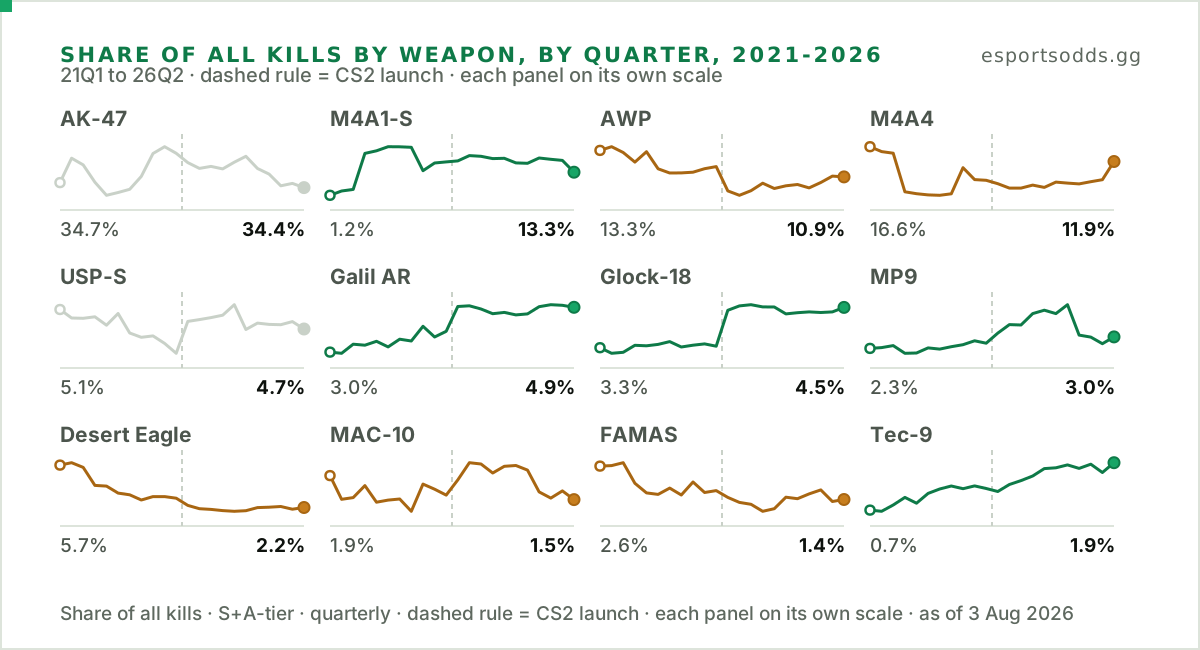
Each panel is scaled to its own range, which is the only way to show a gun at 35% and a gun at 0.7% on the same page. Shape is comparable between panels; height is not. Both endpoint values are printed so the fitted scale cannot flatter a small move.
The dashed rule is worth dwelling on, because it is the same x-position in all twelve panels. The Galil AR, the Glock-18 and the Tec-9 all step up on it. The AWP steps down on it. The AK-47 walks straight through it without noticing.
Two rifles are doing almost all the work. The AK-47 and the M4 platform together account for close to 60% of every kill in professional Counter-Strike, and the AK's line is the flattest in the set. The T-side eco guns tell the opposite story: the Galil AR, the Glock-18 and the Tec-9 all rise steadily and none of them ever had a moment anyone argued about.
Then there is the tail. These panels are half-yearly rather than quarterly, because a gun this rare does not have enough kills in a single quarter to plot honestly: split the AUG by quarter and its thinnest bucket holds ten kills. The trade is that the CS2 rule can only sit at a half-year boundary here, and the bucket it lands on straddles the launch.
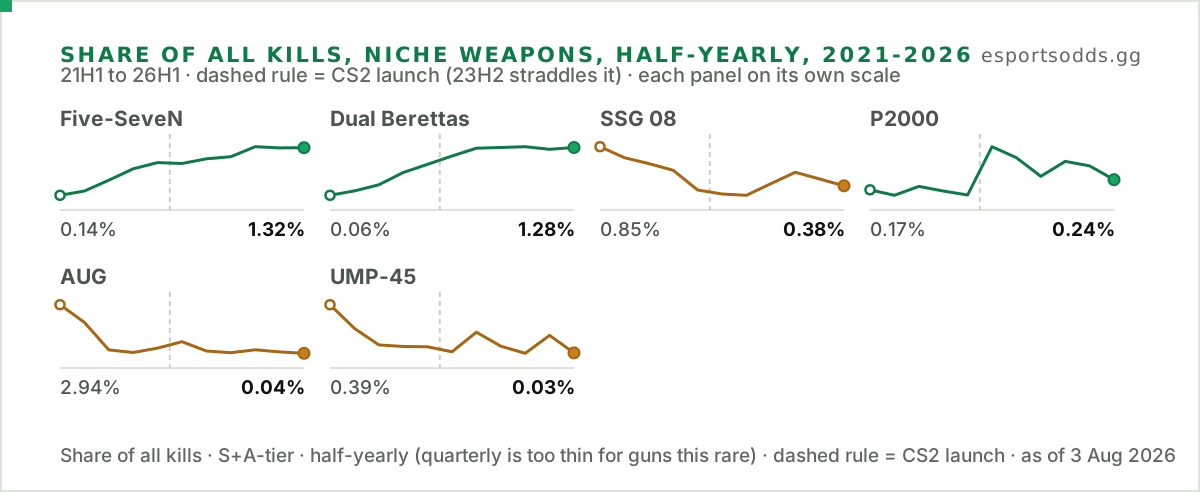
The AUG is the most complete disappearance in the dataset. It took 2.94% of kills in the first half of 2021, more than the FAMAS does today, and now takes 0.04%. That is a weapon leaving professional play almost entirely. The UMP-45 went the same way.
Going the other direction, the Five-SeveN grew roughly tenfold and the Dual Berettas twentyfold, from rounding errors to about 1.3% each. Neither has quite caught the FAMAS, which still takes 1.42%, but both have closed most of the gap from nowhere.
The CT rifle that will not settle
The M4 is the CT-side rifle, and it comes in two versions: the suppressed M4A1-S and the louder, cheaper-per-bullet M4A4. Teams pick one. Almost nobody splits.
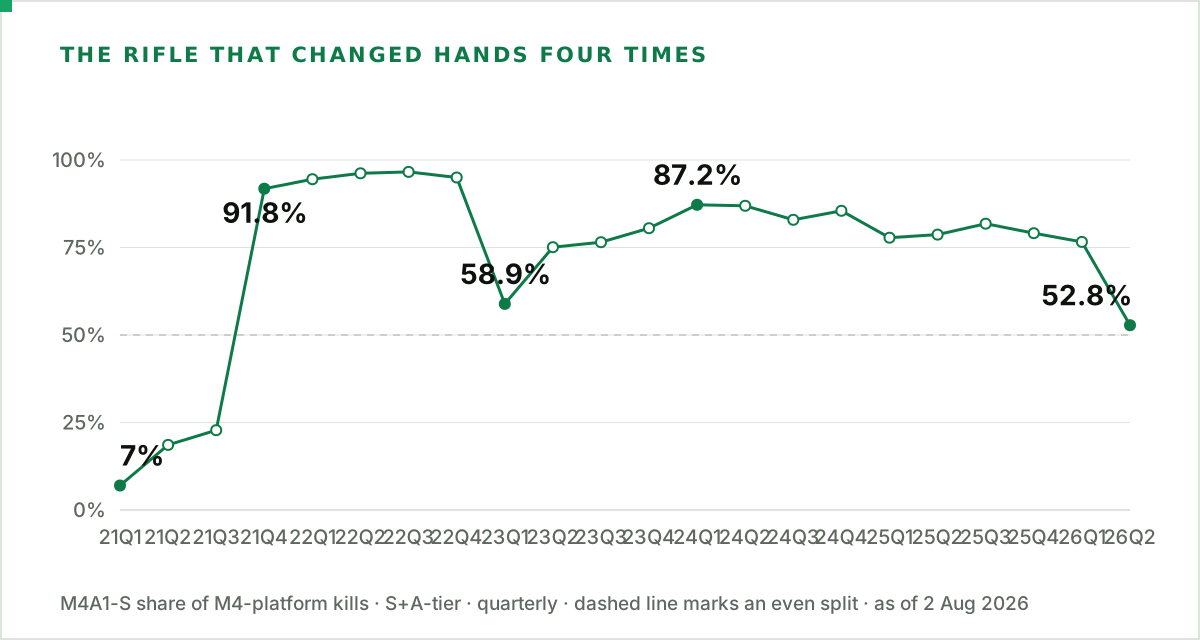
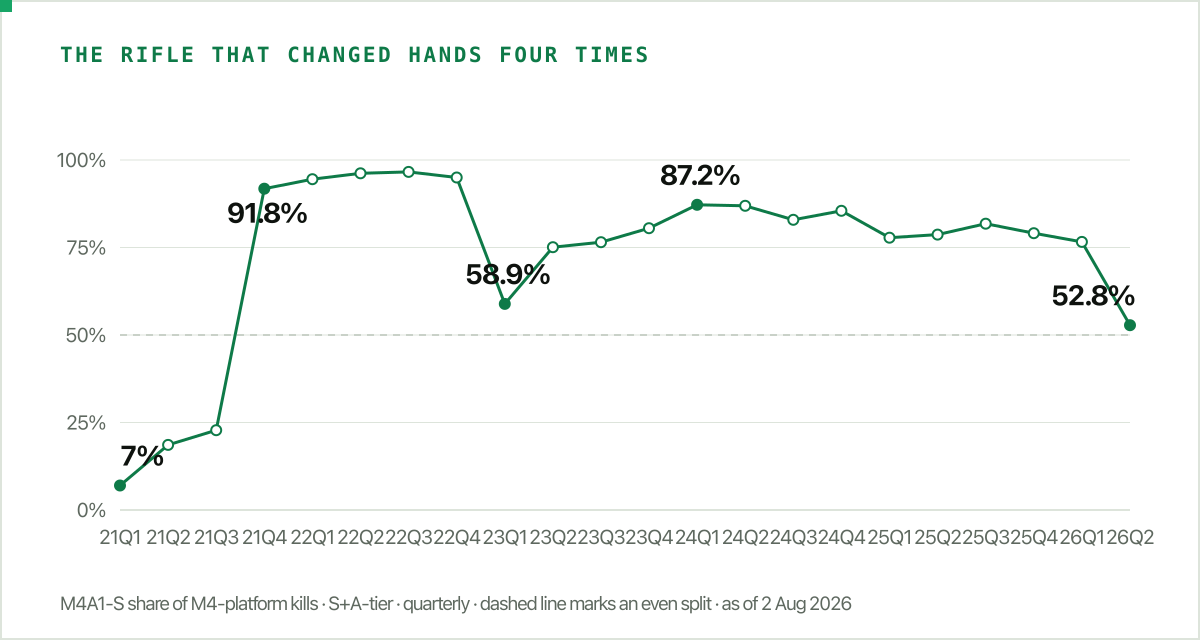
Four reversals in five and a half years. In early 2021 the M4A1-S took 7.0% of M4-platform kills, meaning the M4A4 was near-universal. By the last quarter of 2021 that had inverted to 91.8%, and it held above 94% through all of 2022. The first quarter of 2023 knocked it back to 58.9%. It climbed again to 87.2% by early 2024, drifted through the high seventies for two years, and has now fallen to 52.8%.
Worth being precise about what that means, because it is easy to overstate. Four swings is not four changes of hands: after the 2021 inversion the M4A1-S stayed the majority pick the whole way through, and the later moves are large shifts in preference rather than the lead changing. On this quarterly series the M4A4 has led exactly once, before the end of 2021.
That last move is the one covered in our analysis of the March 2026 reload update, which found the AWP unchanged and the M4A1-S collapsing instead. What that piece could not show, because it only looked at one patch window, is that the M4 has been doing this for years. The current swing is the fourth, and the third largest: the 2021 inversion was far bigger, and the 2023 drop was bigger too.
Provisionally, the M4A4 is back in front. Monthly, it edged ahead in June 2026 at 49.1% and July sits at 49.2%. Both are thin slices and should be treated as a signal rather than a result, but the quarterly series has not crossed back yet.
The gun that never moved
Set the two eras side by side and rank every weapon by how much its share of kills changed.
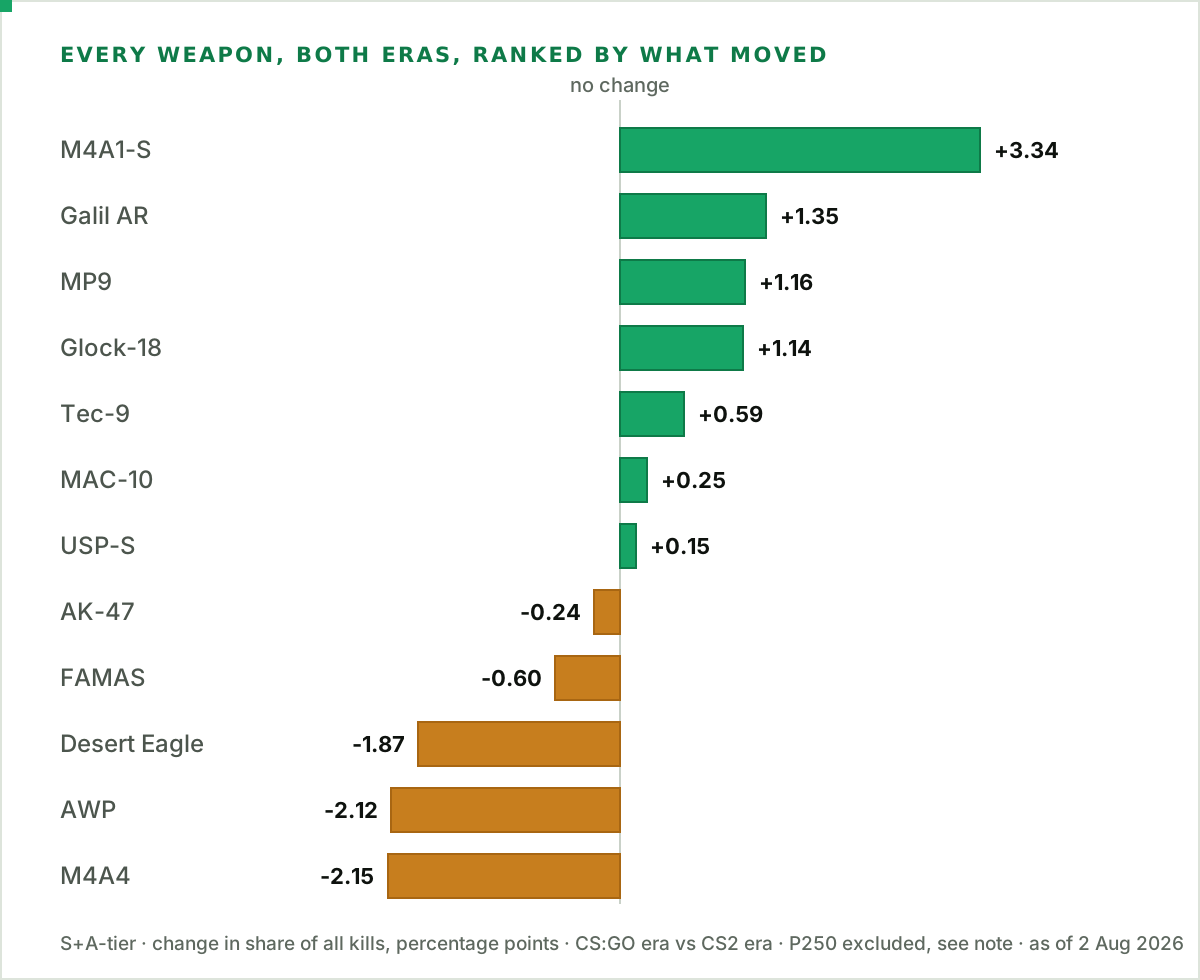
The AK-47 moves 0.65 percentage points, from 35.99% of kills to 35.34%. It is the most-used weapon in the game by a wide margin, it survived an engine replacement and a format change, and it came out the other side within two thirds of a point of where it started. Every argument about Counter-Strike's balance over this period happened around a gun that barely moved.
The eras here come from the game_version field on each match rather than a calendar cutoff, which matters more than it sounds. CS and CS2 overlap in our data for about four weeks, and that overlap turns out to be useful.
Checking it against years when nothing happened
A break that lands where you expected it is exactly the kind of finding that deserves a control. So we ran the identical calendar split in two neighbouring years, both of which had no version change at all.
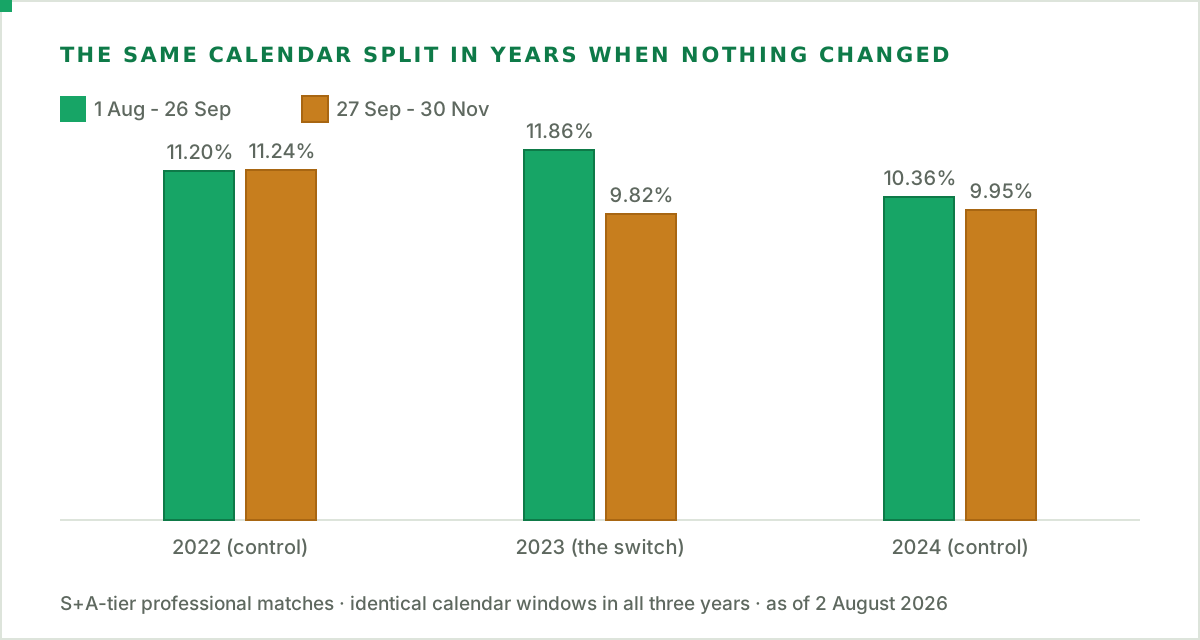
In 2022 the AWP moved by four hundredths of a percentage point across the same dates. In 2024 it moved by four tenths. In 2023 it moved by 2.04 points, roughly five times the larger of the two control years.
The pistol share behaved differently and is worth flagging as a negative result. It rose 1.44 points across the 2023 split, which looks meaningful until you see that it moved 1.16 points in the opposite direction across the 2022 control. That shift is not separable from ordinary drift, so we are not claiming it.
The AWP was already sliding
The October 2023 drop is real, but it is a step down inside a decline that had already been running for two years.
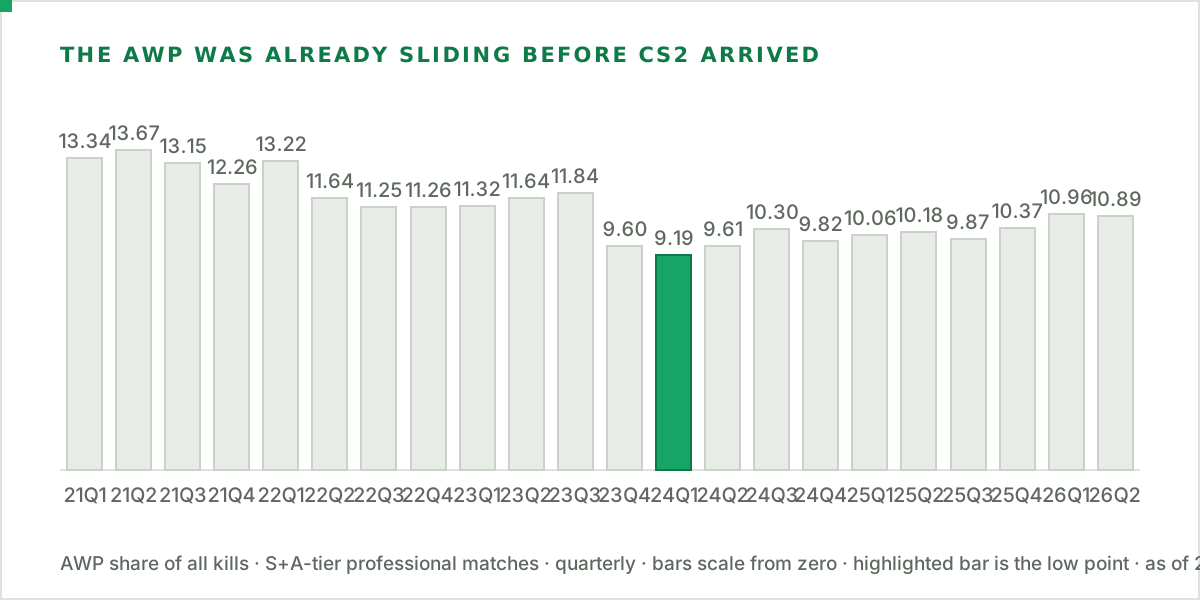
The AWP was taking 13.3% of kills at the start of 2021 and 11.8% by the third quarter of 2023, before anything changed. Then it fell to 9.60% and bottomed at 9.19% in the first quarter of 2024. Monthly, the step is sharper still: 11.78% in September 2023, 9.34% in October.
It has been climbing back ever since, reaching 10.89% by the second quarter of 2026. Three years on, it has recovered most of the drop but not all of it, and it has never returned to where it was in 2021.
The shot that changed
Every chart so far measures which gun took the kill. This one measures how the kill was taken, and it is the sharpest break in the whole dataset.
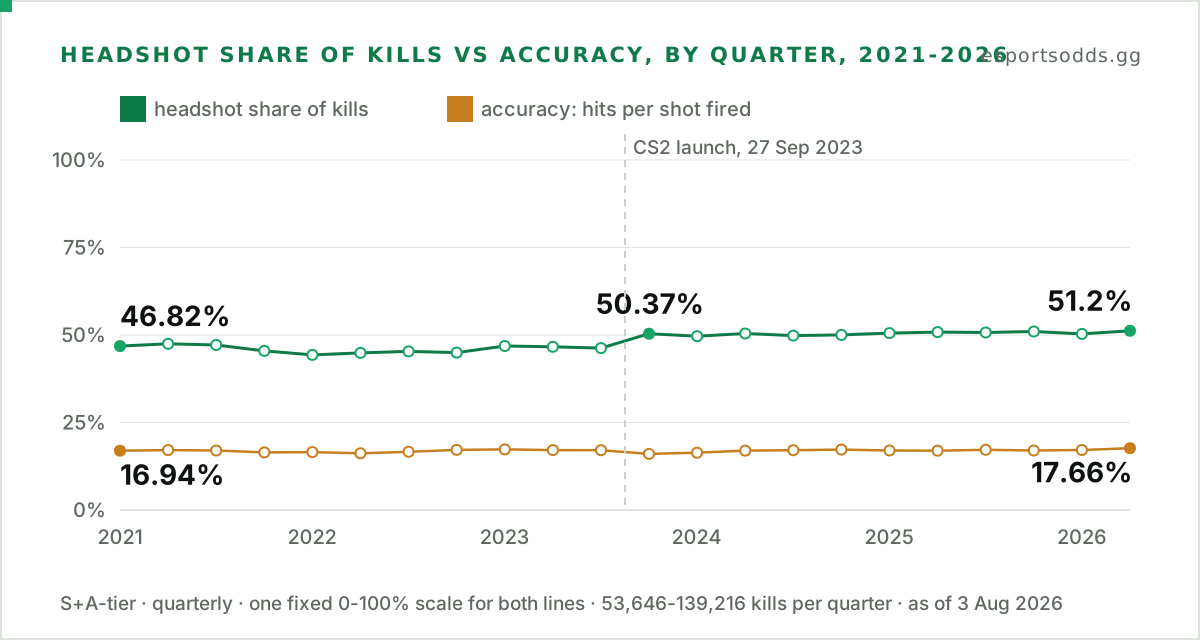
For eleven quarters the headshot share of professional kills sat between 44.3% and 47.5%. In the quarter CS2 arrived it went to 50.4%, and it has not been below 49.6% since. That is a four-point step in three months, after three years of drift.
The second line is why this is worth a chart. Accuracy did not move. The share of bullets that hit anything runs between 16.0% and 17.7% across the entire period, straight through the rule. Players are not landing more of their shots. A higher share of the shots they land are going to the head.
Both numbers come from the same rows of the same table, which is the point: a change in how the data was recorded would move them together. It moved one.
Three checks before we believed it. The step holds inside every tier separately, at 4.3 points in S-tier, 3.4 in A and 3.6 in B. The same calendar split in 2022 and 2024, years with no version change, moves the number by 0.26 and 0.08 points against the real 3.99. And the falsification test: the AWP kills with one shot to the chest, so a headshot is not required and its rate should barely respond. It moves 0.61 points, against 3.37 for the other rifles and 3.73 for pistols. A recording change at the version boundary would have dragged the AWP along with everything else.
What we cannot tell you is why. Sub-tick updates, hitbox changes and the move to a new engine all arrived together, and this data cannot separate them any more than it can separate the engine from the format.
The weapon that actually collapsed
The AWP gets the arguments. The Desert Eagle got the damage.
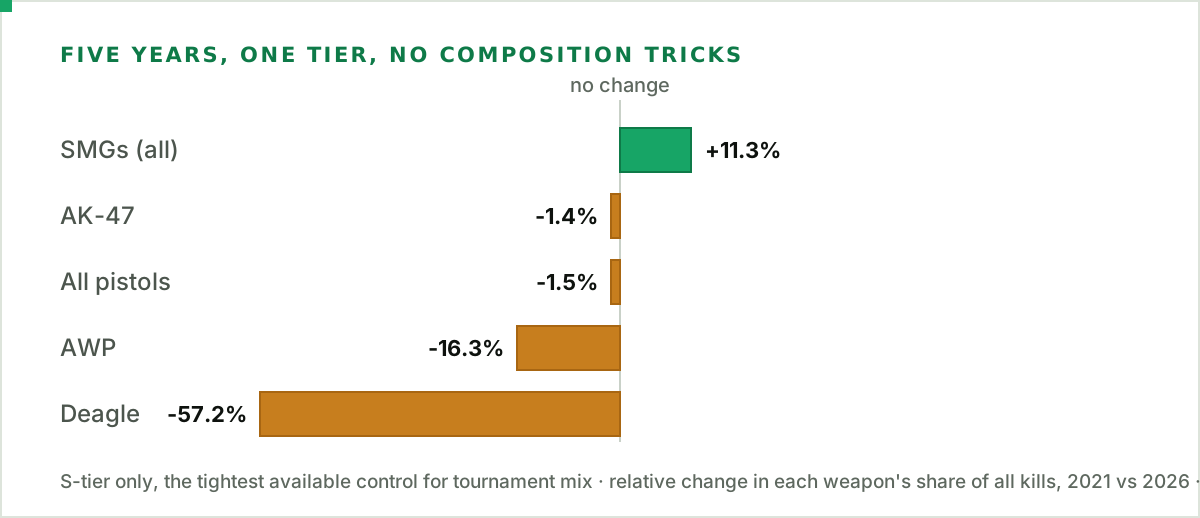
In S-tier matches only, the tightest control available for tournament mix, the Desert Eagle went from 5.10% of all kills in 2021 to 1.97% in 2024 and sits at 2.18% now. That is a 57% reduction in its share of kills, the largest decline of any weapon in the corpus, and it happened across two separate step changes rather than one dramatic patch.
Over the same period and the same tier, the AK-47 moved 1.4% and all pistols together moved 1.6%. Submachine guns went the other way, up 11.2%.
What a kill actually costs
Kill share and shots-fired share are not the same measurement, and the gap between them is where the AWP stops looking like a rifle.
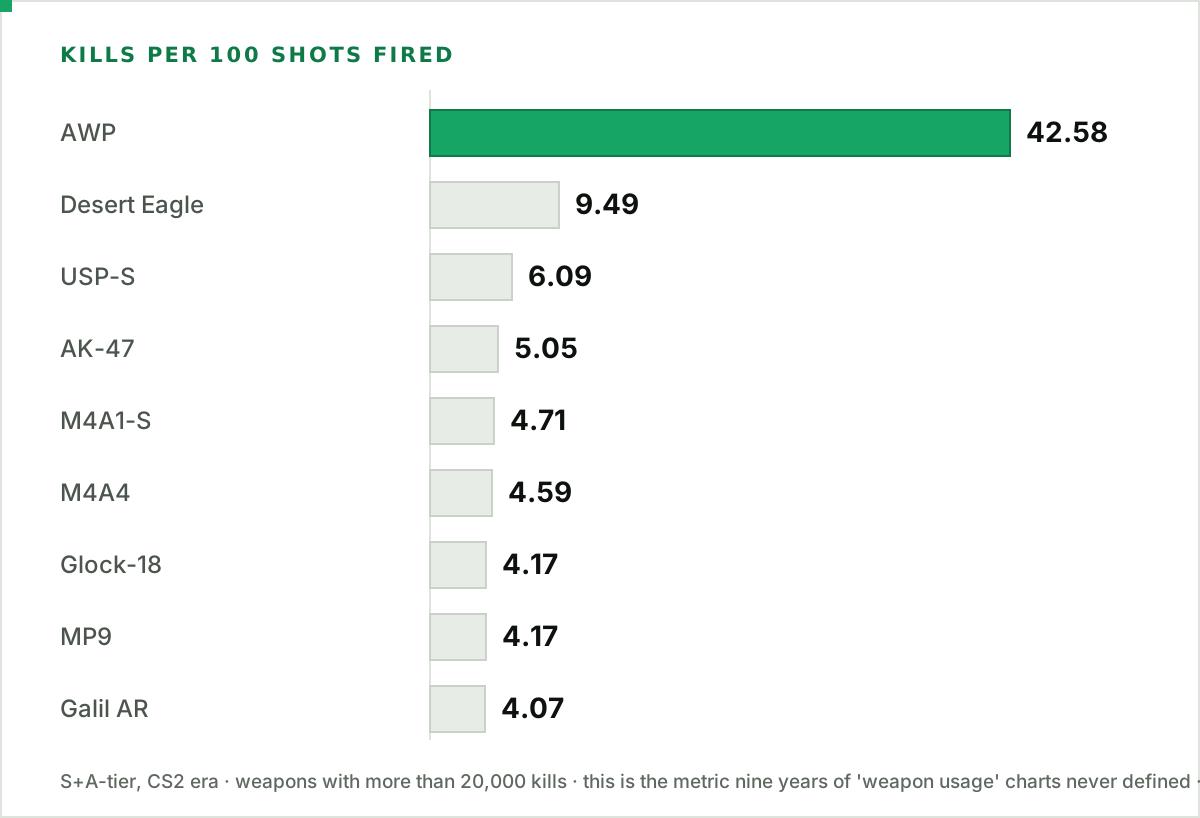
The AWP converts 42.58 kills per 100 shots. The AK-47 converts 5.05. In CS2-era S and A-tier matches the AWP accounts for 10.13% of all kills from 1.02% of all shots fired, roughly eight times more lethal per trigger pull than the rifle that dominates the kill charts.
This is why the definition question was never idle. On kill share the AK is the most-used weapon in Counter-Strike and it is not close, at 35.33%. On shots fired it is close to that again, at 30.12% of every bullet. On kills per shot it is fourth, behind a sniper rifle and two pistols.
Where the field sits now
Team by team, across S and A-tier matches in 2026, AWP reliance spans a wider range than you might expect from teams playing the same game.
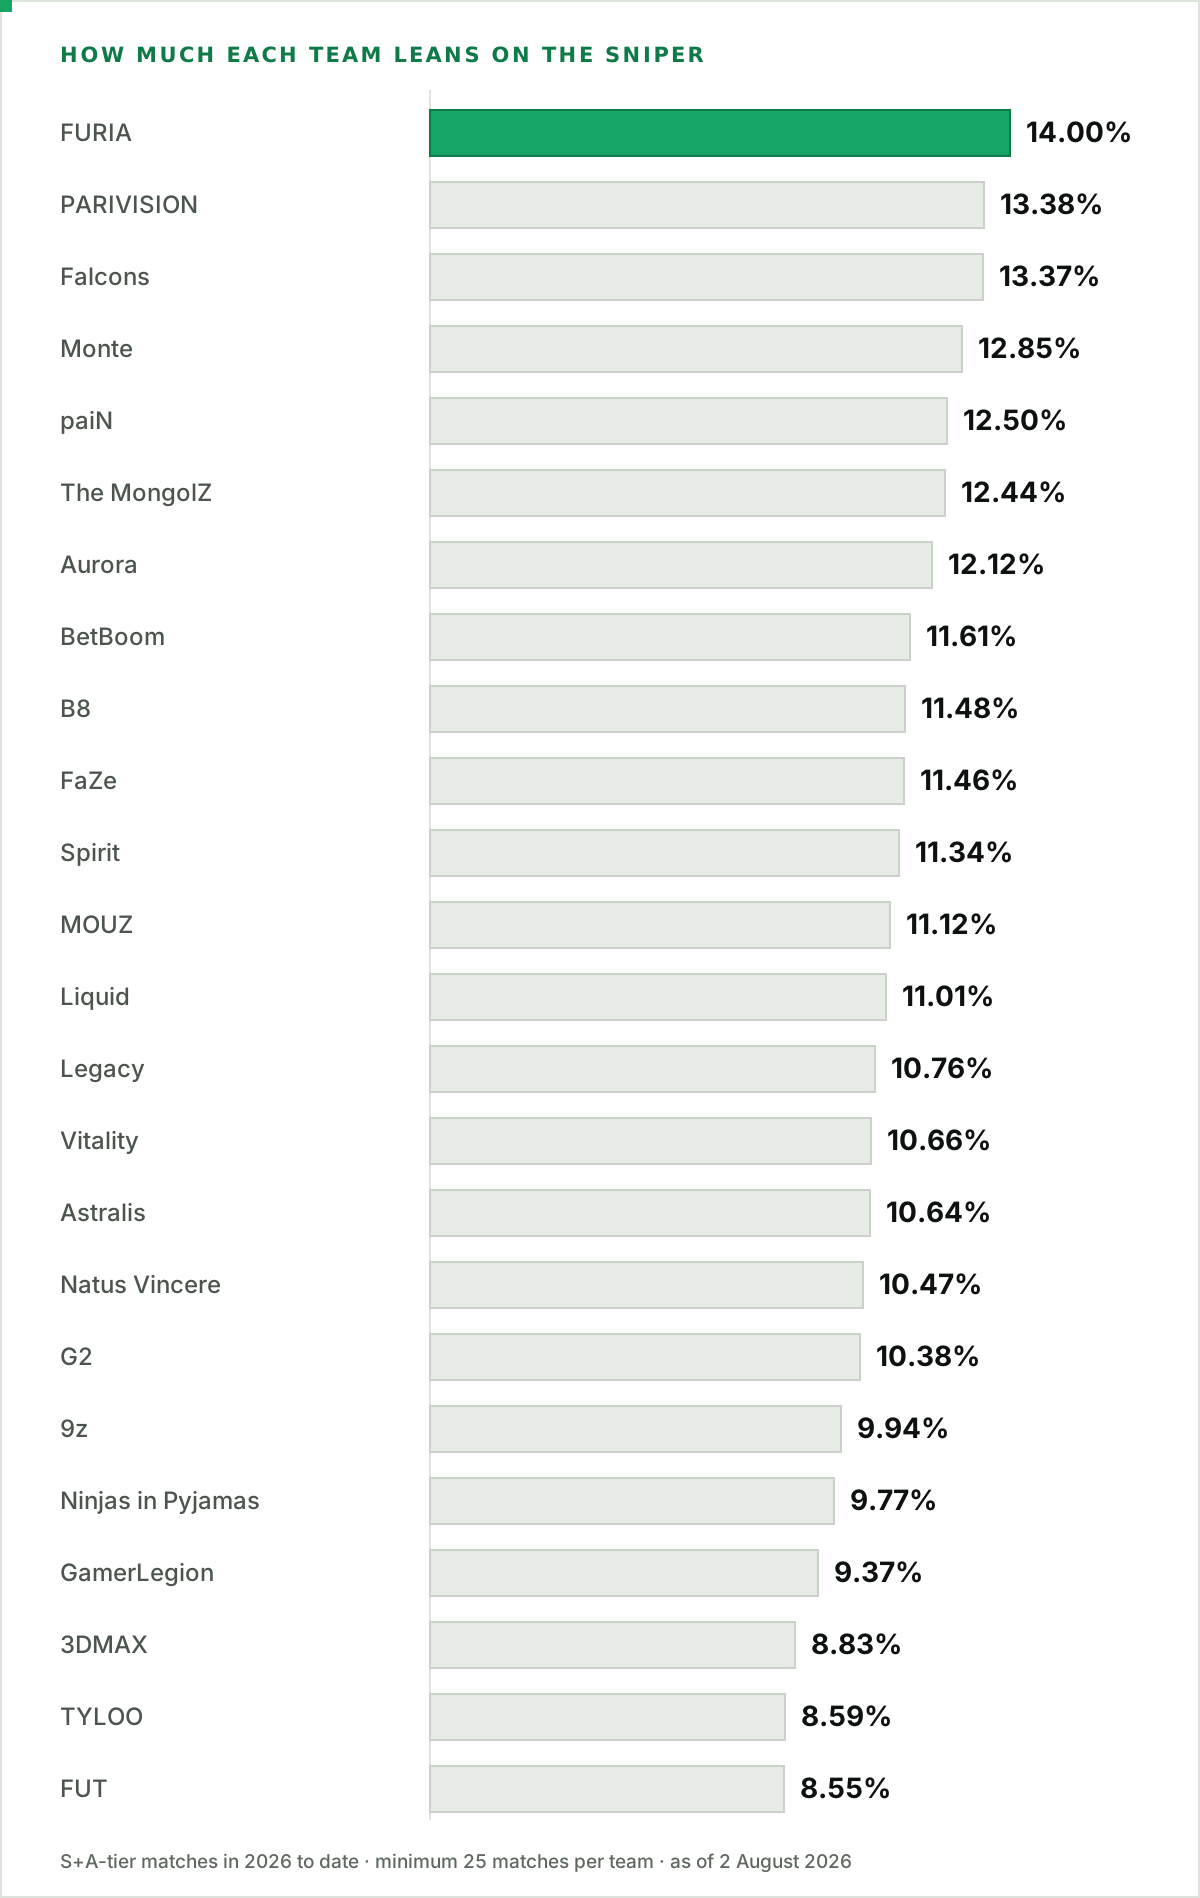
FURIA put 14.00% of their kills through the AWP; HEROIC put 7.70%, a little over half as much. The M4 question splits the field even harder. Aurora still route 87.1% of their M4 kills through the M4A1-S, while Vitality are down at 29.2% and 9z at 31.8%, effectively converted to the M4A4 while much of the field has not moved.
What this does and does not show
Four limitations, stated plainly, because they change how much weight these numbers carry.
Two things changed on the same day, and we cannot separate them. CS2 arrived and the match format moved from MR15 to MR12 simultaneously. In our data CS never played a single MR12 match, and only about a dozen CS2 matches ever ran MR15. The two changes are collinear. Anyone telling you the engine did this, or that the format did it, is going beyond what this data can support.
The map pool changed too. Restricting to single-map matches on the same map, the AWP drop shows up clearly on Ancient and Mirage but barely on Inferno, and several maps have no meaningful CS sample. Map composition is a partial explanation we cannot fully remove.
The P250 is excluded from every chart here, from the denominator as well as the bars. Measured across all tiers, its recorded kills fall to 1.3% of the CS rate across the version boundary, while the AK-47, as a reference point, sits at 77.1%, which is roughly what a shorter match format alone predicts. A pistol bought on most force-buys did not lose 99% of its kills. That is a gap in the underlying record, not a change in behaviour, and publishing it as a finding would have been wrong. Leaving it in the denominator would have been almost as bad: because the missing kills shrink the CS2-era total, every other weapon's CS2 share is inflated by roughly 2% until it is removed from both halves of the fraction.
No patch attribution. We can date every turning point above precisely. We are deliberately not naming which update caused which, because we could not verify the patch notes against a primary source.
The short version
The AK-47 has held roughly 35% of professional kills since 2021, through an engine replacement, a format change, and four separate arguments about the CT rifle. The M4 has swung hard four times in the same period and is mid-swing again. The AWP's decline started well before CS2 and has partly reversed since. The Desert Eagle lost more ground than any of them and generated none of the discussion.
For how the round economy shapes which of these guns ever gets bought, see the CS2 economy explained; for a static snapshot of where weapon shares sit today, see CS2 weapon meta by the numbers; and for what one specific patch did and did not do, see the AWP nerf that wasn't. The methodology behind every number here is documented in how we build our data.
Cite this
EsportsOdds, "CS2 weapon usage over time: every gun, 1.9M pro kills", 2 August 2026. https://esportsodds.gg/learn/cs2-weapon-usage-over-time