Bottom line: The CS2 stats API returns clean JSON rows that drop straight into a pandas DataFrame. Pull
/matches/{id}/stats, load it, and you can rank players by ADR, rating, or KAST in a couple of lines. Two things to know going in: some fields (kast,headshots,multikills_2k) are nullable, so coerce them; and each player has both an aggregate row and per-map rows, distinguished bymap_number. Worked examples below, all against the EsportsOdds CS2 data API.
The shape of the data
The pipeline is short: fetch JSON, build a DataFrame, analyse. No scraping, no HTML parsing, no cleanup of half-broken markup.
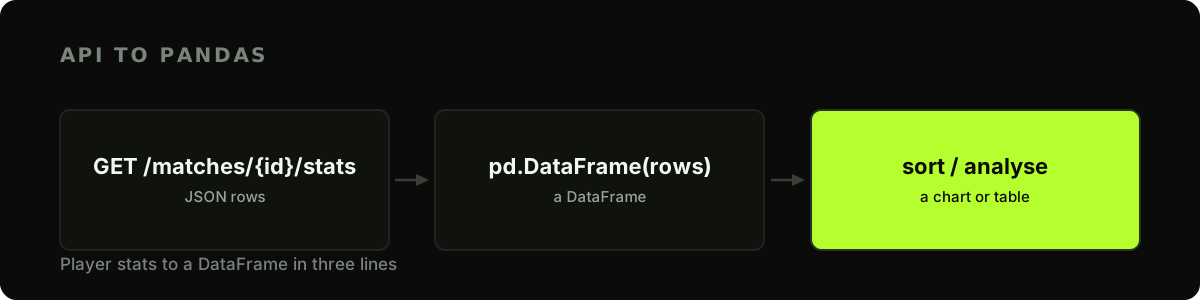
Each row from /v1/cs2/matches/{id}/stats is one player's performance. A handful of fields are always present; the rest are enrichment that may be null depending on how much detail was parsed for that match.
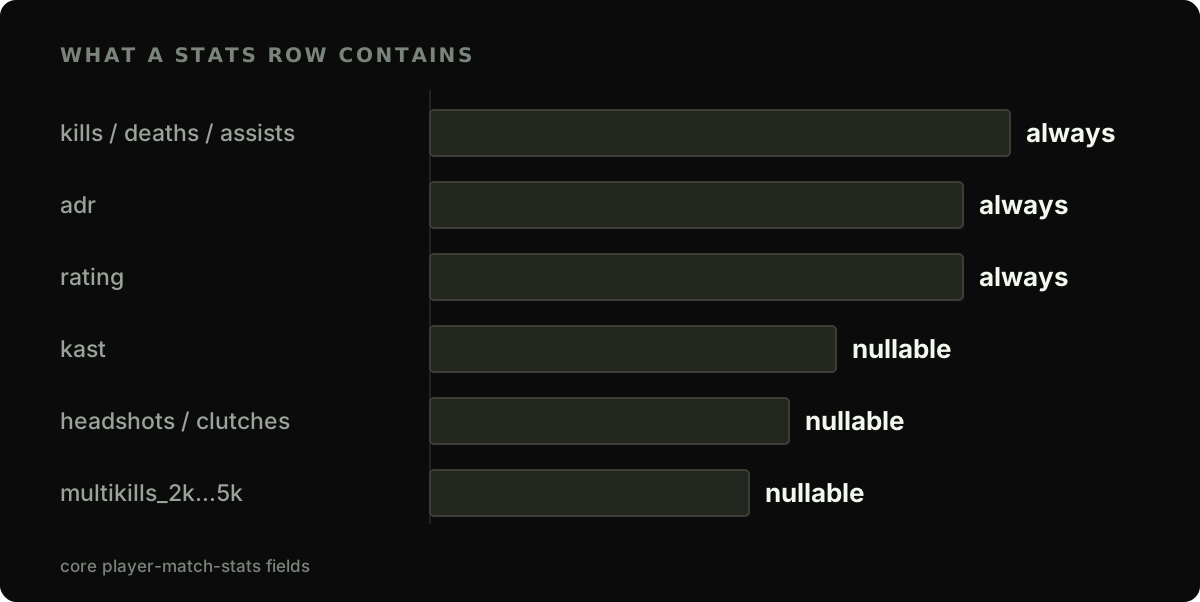
The always-present fields are kills, assists, deaths, adr, and rating. Note that rating is our own computed rating, not a third party's; it sits on the same 1.0-is-average scale you'd expect, but it's ours, and the methodology shows how it's built. The nullable ones include kast (a 0–1 fraction), headshots, first_kills, clutches, damage, and multikills_2k through multikills_5k.
Load a match into a DataFrame
Here's the whole thing. Fetch, normalise, and you have a table:
import os
import requests
import pandas as pd

BASE = "https://api.esportsodds.gg"
KEY = os.environ["ESPORTSODDS_API_KEY"]
HEADERS = {"Authorization": f"Bearer {KEY}"}


def match_stats(match_id: str) -> pd.DataFrame:
    resp = requests.get(
        f"{BASE}/v1/cs2/matches/{match_id}/stats",
        headers=HEADERS, timeout=15,
    )
    resp.raise_for_status()
    return pd.json_normalize(resp.json()["data"])


# Fetch a real match id first. The matches list is newest-scheduled-first, so limit=1
# with status=completed is the most recent completed match, and has=stats keeps only
# matches that actually carry stats rows to load.
resp = requests.get(
    f"{BASE}/v1/cs2/matches",
    params={"status": "completed", "has": "stats", "limit": 1},
    headers=HEADERS, timeout=15,
)
resp.raise_for_status()
match_id = resp.json()["data"][0]["id"]

df = match_stats(match_id)
print(df[["player_id", "kills", "deaths", "adr", "rating"]].head())
pd.json_normalize reads the data array directly into rows. Because the stats list isn't paginated (a match has a bounded number of performances), one call returns every row.
Handle the aggregate-vs-per-map split
One subtlety: the response contains both a match aggregate row per player and, where map-level detail exists, one row per map. They're distinguished by map_number — it's null on the aggregate and an integer (1, 2, 3…) on each map.
If you want a clean per-player table, keep the aggregates:
# Keep only the whole-match aggregate rows (map_number is null there).
agg = df[df["map_number"].isna()].copy()
If instead you want to compare a player's map 1 to their map 3, filter the other way (df[df["map_number"].notna()]) and group by map_number.
Coerce the nullable columns
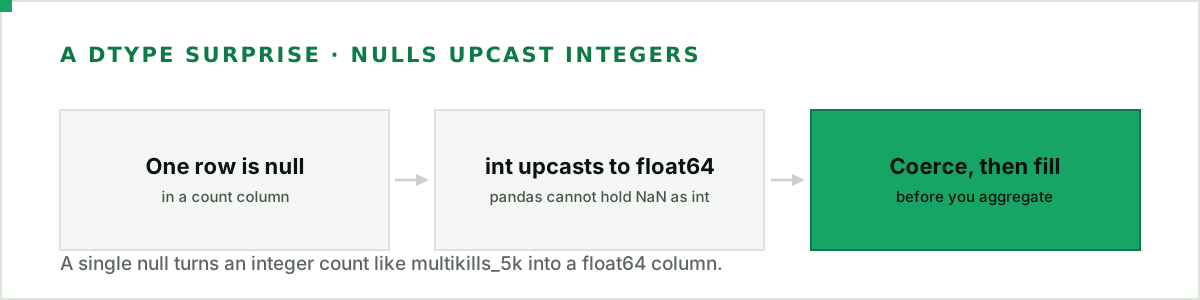
Before you do arithmetic, make the nullable numeric fields safe. A missing kast arrives as None, which pandas reads as NaN under its ordinary missing-data rules. There's a subtler consequence too: because a column can hold a null, json_normalize can't keep it as an integer, so it upcasts the whole column to float64. An integer count like multikills_5k comes back as 1.0 and NaN, not 1 and 0. It's harmless once you coerce it back to numeric, but it surprises anyone expecting an int dtype:
numeric = ["kast", "headshots", "damage",
           "multikills_2k", "multikills_3k", "multikills_4k", "multikills_5k"]
for col in numeric:
    if col in agg:
        agg[col] = pd.to_numeric(agg[col], errors="coerce")

# KAST comes back as a 0–1 fraction; show it as a percentage.
if "kast" in agg:
    agg["kast_pct"] = (agg["kast"] * 100).round(1)
Leave the NaN rather than fill it with 0: an absent count means "not parsed for this match," not "the player recorded zero," and a fabricated 0 would drag any average you compute.
Rank and chart
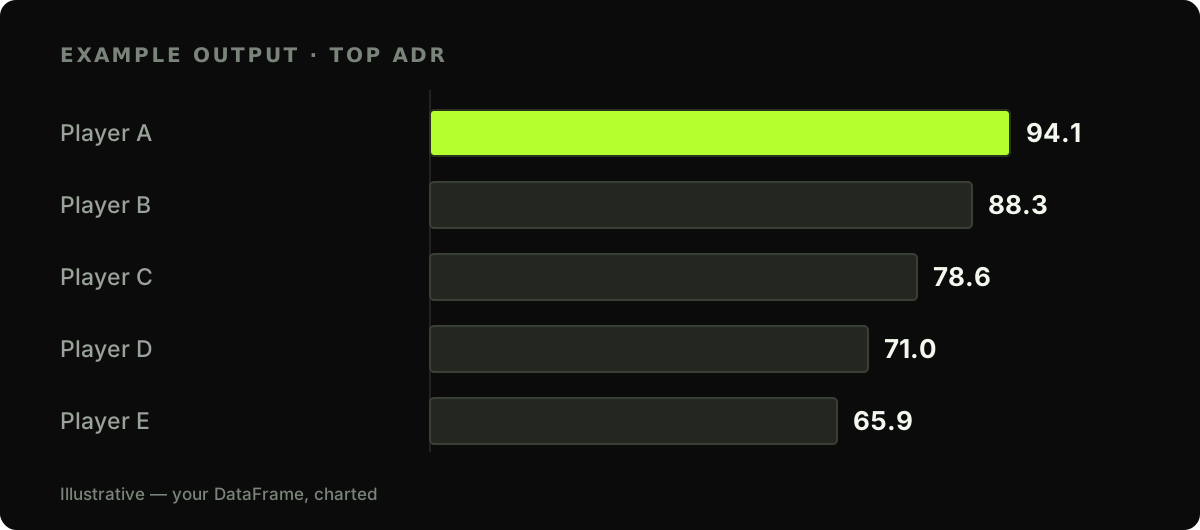
Now the fun part. Top five by ADR:
top = agg.sort_values("adr", ascending=False).head(5)
print(top[["player_id", "adr", "rating", "kast_pct"]])
And a quick horizontal bar chart with matplotlib:
import matplotlib.pyplot as plt

top = agg.sort_values("adr", ascending=False).head(5)
plt.barh(top["player_id"].astype(str), top["adr"])
plt.xlabel("ADR")
plt.gca().invert_yaxis()   # highest at the top
plt.tight_layout()
plt.savefig("top_adr.png")
The result is the kind of leaderboard you can drop into a report or a stream overlay:
Group by team, not just player
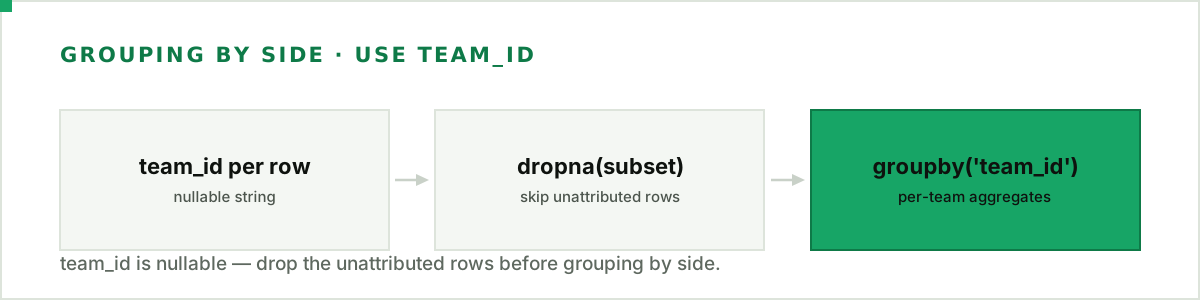
Each row also carries team_id, attributing the line to the team the player played for in that match. It's a nullable string (older rows may not resolve to a team), so drop the unattributed rows before you group, then aggregate by side:
by_team = (
    agg.dropna(subset=["team_id"])
       .groupby("team_id")[["adr", "rating"]]
       .mean()
       .round(2)
)
Pulling many matches at once
To analyse a whole tournament rather than one match, combine this with the pager from the match-data guide: page through /matches for the event, then pd.concat the stats from each. If you're pulling dozens of matches, add the backoff logic from the rate-limits guide so a burst of requests doesn't hit the per-second limit.
# tournament_matches: page /matches for the event first (see the match-data guide's
# pager); each row carries an "id".
frames = [match_stats(m["id"]) for m in tournament_matches]
season = pd.concat(frames, ignore_index=True)
From there it's ordinary pandas: groupby("player_id").mean() for season averages, rolling windows for form, whatever your analysis needs.
Next steps
- Build fantasy projections — turn career averages into a projected score.
- Generate a match preview — pair these stats with head-to-head and form.
- Skip the plumbing with the official Python client —
pip install esportsoddsreturns each match's stats as plain dicts, ready forpd.DataFrame.
Clean JSON in, a DataFrame out, and the whole of pandas to work with. Coerce the nullable columns once, keep the aggregate-versus-map split straight, and the rest is the analysis you actually came to do.
Full API reference: the player match-stats field reference in the developer docs.