Bottom line: Our corpus holds 22,705 completed professional Counter-Strike matches as of 16 July 2026, going back to November 2020. 16,235 of those were played on Counter-Strike 2; the other 6,470 predate its September 2023 launch and were played on CS. Per-player stats exist for 20,527 matches — 90.4% of completed ones. Those four numbers say more about what you can and cannot model than any coverage table.
Most data providers publish a match count and stop. A match count on its own is close to meaningless: it tells you nothing about which era the matches come from, how much of the detail survived ingestion, or where the gaps sit. Here is the full shape of ours, with the awkward parts left in.
The era split nobody mentions
Counter-Strike 2 replaced CS on 27 September 2023. That is a hard boundary in a way most sports-data boundaries are not: the game engine changed, the movement changed, and the economy was retuned.
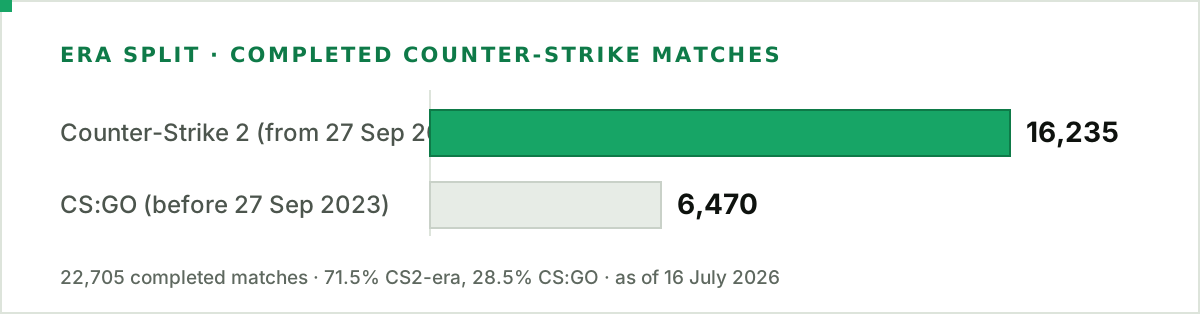
| Era | Completed matches | Share |
|---|---|---|
| Counter-Strike 2 (from 2023-09-27) | 16,235 | 71.5% |
| CS (before 2023-09-27) | 6,470 | 28.5% |
| Total | 22,705 | 100% |
This matters because "22,000+ CS2 matches" would be a false claim, and you will see providers make it. Only the 16,235 matches from 27 September 2023 onward are CS2; the remaining 28.5% of our corpus is CS. We serve all of it under one schema: the competitive lineage is continuous, and rosters and tournaments carry across. But the label has to be honest, and a model trained across the boundary should know the boundary is there.
If you are backtesting, the CS rounds are usable history, not interchangeable data. Treat the era as a feature, not a footnote.
Where the depth actually stops
Coverage degrades as you go deeper into a match, in a pattern typical of competitive-esports data:
- Fixtures and results: effectively complete across all 22,705 completed matches.
- Map scores: present on over 92% of completed matches as of that date, with most of the gaps in lower-tier matches whose maps were never parsed, plus forfeits.
- Per-player match stats (K/A/D, ADR, KAST, clutches, multi-kills): present on 20,527 matches, or 90.4% of completed ones.
- Per-round detail (economy, duels): thinner again, and we treat it as present-or-absent per match rather than a layer we can quote a single coverage figure for.
The 9.6% of completed matches with no per-player stats (2,178 of them) are missing that layer for a reason, even if we cannot say exactly which matches they are. Stats are usually absent because nobody recorded at that granularity, and lower-tier qualifiers and regional online leagues are the usual suspects, but that is the mechanism, not a measured breakdown by tier. Any player-level model built here is therefore a model of the matches someone bothered to record, skewed toward better teams at bigger events. That is a real selection effect, and ignoring it does not make it go away.
The reference data underneath
| Entity | Count |
|---|---|
| Players | 4,633 |
| Teams | 1,495 |
| Tournaments | 876 |
The team count is larger than most people expect, and it is the best illustration of why entity resolution is the hard part of esports data. Organisations rename, get acquired, field academy sides, and appear under regional variants. 1,495 team rows are not 1,495 active organisations — they are 1,495 distinct competitive entities we have had to keep separate, and stable, across nearly six years.
Player counts have the same problem in miniature: nicknames change, and the same person can appear under two or three handles across the nearly six years we cover.
Those 1,495 teams are not 1,495 evenly-matched contenders either. Keep only teams with a real sample (at least 20 maps played) and 504 qualify, their map win-rates spread wider than people expect. Turning rows like these into a defensible ranking is hard in itself: Valve publishes the source code behind its Counter-Strike Regional Standings rather than a fixed table, a fair signal of how much judgement any single ranking hides.
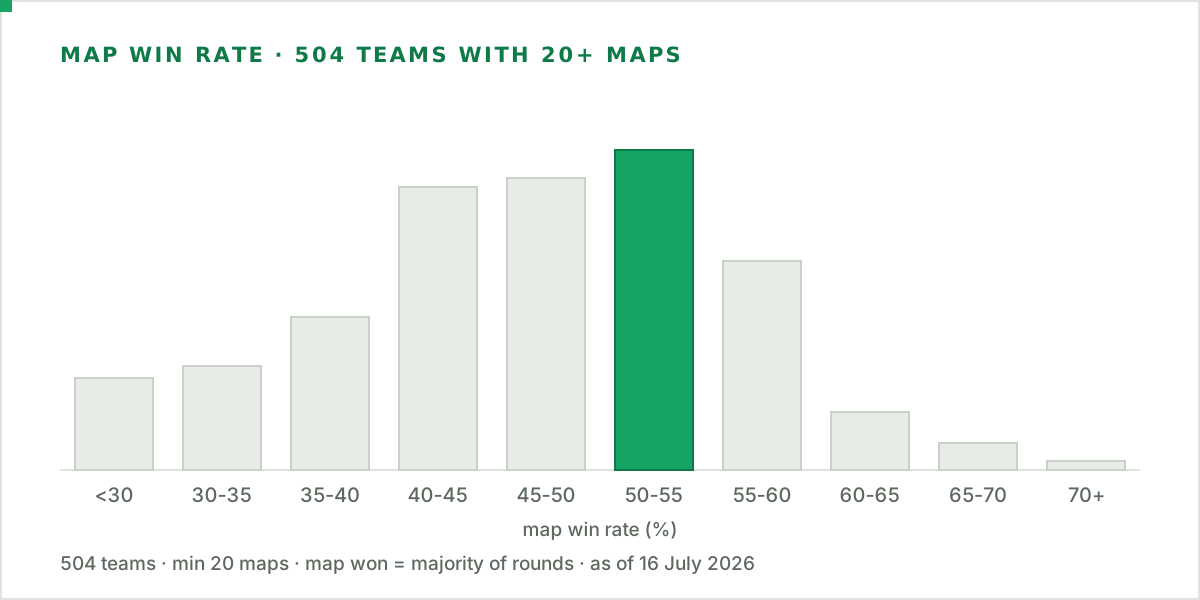
Across those 504 teams, 359 (71%) sit between a 40% and 60% map win-rate, the churn of roughly even matches. Only 31 (6.2%) clear 60%, and a longer tail of 114 (22.6%) sits below 40%. The 20-map minimum matters: it stops three good series from crowning a world-beater, and it is why the count of teams with a meaningful record is 504, not the full 1,495.
What a raw count hides
The whole point of this piece is that a number without its context misleads, so here is one from our own tables. Count how often each map is banned in the veto phase and an apparent pecking order falls out: Inferno leads with 11,867 bans, Train sits near the bottom at 4,143. Read naively, that says teams dislike Inferno three times as much as Train.
They do not. The counts are confounded by how long each map has spent in the competitive pool: one bannable for years accumulates bans a recently added or returned map never had the chance to. Cache, which had only just re-entered our data when this was written, sat at 171 bans (1,768 by 17 October): not because nobody bans it, but because there had barely been a window in which anyone could. The count measures availability at least as much as preference, and reading a strategy conclusion out of it would be a mistake. Same lesson as the era split and the coverage ceiling: a number is only safe once you know what sits behind it.
Why we published the awkward numbers
A dataset you cannot interrogate is a dataset you cannot trust. A 28.5% CS share, a 90.4% stat-coverage ceiling, and 1,495 team entities that needed resolving are the kind of facts that would have bitten you three weeks into a project. Better to know now.
There is a fourth, added in this revision, and it is the most awkward of the set. Our weapon-kill totals, 6,677,283 kills, are byte-for-byte identical to the pull we took six days earlier, even though the match count grew over that window. Match ingestion moved; weapon-stat ingestion, on this evidence, appears to be lagging behind it, and we are investigating. We would sooner flag that the weapon layer may be a few days stale than imply it is complete, because it is not, and a coverage table that rounded that off would mislead.
Every figure here was pulled from production on 16 July 2026 and rounded nowhere. Our methodology explains how each count is defined and dated; you can reproduce the numbers yourself through the CS2 data API, and the learn hub explains what the metrics mean once you have them.